Mattermost v7.2 is now available
Mattermost v7.2 is generally available today. The following new features are included (see changelog for more details).


Mattermost v7.2 is generally available today. The following new features are included (see changelog for more details).
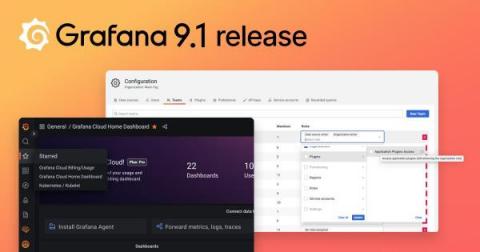
Grafana 9.1 is here! Get Grafana 9.1 We’ve made a number of improvements to Grafana’s usability, data visualization, and security. For a full list of new features and capabilities, check out our What’s New in Grafana 9.1 documentation. You can get started with Grafana in minutes with Grafana Cloud. We have a generous free forever tier as well as plans to suit every use case — sign up for free now. Here are some of the highlights in Grafana 9.1.
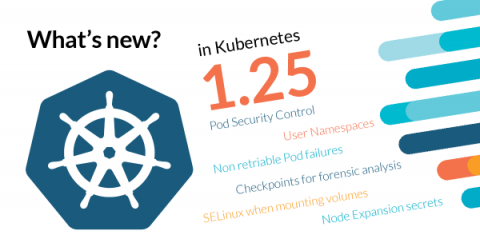
Kubernetes 1.25 is about to be released, and it comes packed with novelties! Where do we begin? This release brings 40 enhancements, on par with the 46 in Kubernetes 1.24 and 45 in Kubernetes 1.23. Of those 46 enhancements, 13 are graduating to Stable, 10 are existing features that keep improving, 15 are completely new, and two are deprecated features.
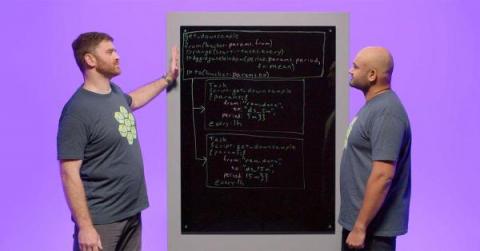
Thanks to Vinay Kumar for being a key contributor to this article. We love to write and ship code to help developers bring their ideas and projects to life. That’s why we’re constantly working on improving our product to meet developers where they are, to ensure their happiness, and accelerate Time to Awesome. This week, we are covering a featured product release that we think will save you time and effort when building with time series, InfluxDB – and specifically – Tasks.
Whether you’re a first-time Linux user, experienced developer, academic researcher or enterprise administrator, Ubuntu 22.04 LTS is the best way to upgrade your creativity, productivity and downtime. Check out our new video to learn more! The release of Ubuntu 22.04.1 LTS represents the consolidation of fixes and improvements identified during the initial launch of Ubuntu 22.04 LTS and is the first major milestone in our Long Term Support (LTS) commitment to our users.
One of our goals here at Checkly is to make it easier for developers to ship excellent software. But let’s face it, getting features out is only a tiny fraction of the story. Fast-moving development teams also break things. And the more things you build, the more things can go wrong. And trust me, they will. This is where API and end-to-end monitoring helps. Define automated test suites that check all your properties constantly and guarantee that everything’s up and running. All the time.
Today’s blog post will give an insight into one of the many things that improved with Icinga DB: how host and service history is written to the database, both by the old IDO feature, as well as what has changed with Icinga DB and how this leads to more reliable results.
Remove any bottlenecks to your network deployments with continuous, end-to-end modern network monitoring software. Modern network architectures like SD-WAN have emerged as game-changing solutions that provide a mechanism for improving traffic management, deployments, and automation.
Hello Retrace and Prefix Customers! In case you missed our Q1 survey invitation, I’m Netreo’s Vice President of Product Management. I joined Netreo for the opportunity to create great business solutions and customer experiences.