Operations | Monitoring | ITSM | DevOps | Cloud

Grafana Agent v0.32 release: New integrations with Oracle, AWS, Microsoft Azure, and more

Grafana Agent v0.32 is now available! This release includes a host of new integrations for the Grafana Agent and components for Grafana Agent Flow so you can easily monitor your vital infrastructure. We’re also excited to announce that Flow is no longer in beta. Introduced last fall, Flow is a new configuration mode that makes Grafana Agent easier and more powerful to run.

New in Grafana Cloud: Key improvements to the command palette and navigation experience

A new navigation experience will be rolled out in Grafana Cloud this month, with improvements designed to make Grafana more seamless to use. Along with updates in Grafana’s search and navigation, there is a new enhanced command palette that helps streamline workflows and allows you to move through the platform without even taking your hands off the keyboard.

Release Trusted Software Faster - Our New release Lifecycle Management Beta Is Here

Releasing production-ready software is a complicated tangle of tools and processes lacking visibility, traceability, and consistency. This leads to custom integrations and human intervention, which create opportunities for mistakes, impede automation, and increase the likelihood of insecure software being released. JFrog’s release lifecycle management capabilities enable “release first” software supply chain (SSC) management, delivering trusted software faster.

Microsoft Teams for Alerting has landed

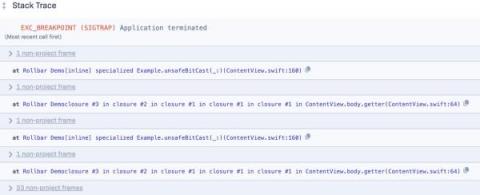
Get crucial error and performance diagnostics sent directly to your chosen Microsoft Teams channel with Raygun Alerting. As of 2022, Microsoft Teams has surpassed Slack’s 18 million active users with a user base of over 270 million, solidifying its position as the leading business communication platform. In August 2021, we released our Slack for Alerting integration, and now it’s time to extend that capability to Microsoft Teams.

Public Dashboards, Incident Management, and Our New Analytics API

Late last year we announced improvements to our public dashboards that included a revamped dashboard design that allowed users to see monitoring data in a more easily-digestible way, on any device. We improved performance across the board, and also introduced new incident management functionality—available for paid plans only—that allows users to more easily communicate scheduled maintenance notices and alert developers to minor and major incidents.

Announcing the General Availability of Playwright Test Support

Back in October of 2022 we unveiled the beta of @playwright/test. We’re now happy to announce that Playwright Test (PWT) is now generally available! We’ve worked hard to make Checkly the best way to run your Playwright tests, and we’ve also decided to make Playwright—which is experiencing a surge in usage and popularity— the default and recommended web testing framework to use with Checkly.

What's new in Calico Enterprise 3.16: Egress gateway on AKS, Service Graph optimizations, and more!

We are excited to announce the early preview of Calico Enterprise 3.16. This latest release extends the active security platform’s support for egress access controls, improves the usability of network-based threat defense features, and scales visualization of Kubernetes workloads to 100s of namespaces. Let’s go through some of the highlights of this release.

Grafana 9.4 release: Easy data source setup, custom panels, Grafana Alerting updates, and more

Grafana 9.4 is here! Get Grafana 9.4 With the latest Grafana release, we’re introducing a wealth of new features and improvements that makes getting started with Grafana even easier and that take your visualizations and observability best practices to the next level. In addition to enabling TraceQL, the new query language for distributed tracing in Grafana Tempo 2.0, for all Grafana Cloud users, the Grafana 9.4 release comes with a fresh round of features.