Operations | Monitoring | ITSM | DevOps | Cloud

Analytics

How to Monitor Amazon Redshift

In the first post of our three-part Amazon Redshift series, we covered what Redshift is and how it works. For the second installment, we’ll discuss how Amazon Redshift queries are analyzed and monitored. Before we go deep into gauging query performance on Redshift, let’s take a quick refresher on what Amazon Redshift is and what it does.

Tracking Malicious Activity across the Sumo Attack Lifecycle

In modern network security monitoring, it is not enough to just detect bad things happening. ROI of security operations is always under scrutiny. Security teams, when they exist, and their leadership (CISOs), continually struggle to get budget, at least until a public breach occurs.

Don't Treat Your Business Metrics Like Other Metrics

Many companies today try to feed business metrics into APM or IT monitoring systems. Splunk, Datadog and others track your business in real time, based on log or application data – something that would seem to make sense. In practice, however, it fails to produce accurate and effective monitoring or reduce time to detection of revenue-impactful issues. Why? Because monitoring machines and monitoring business KPIs are completely different tasks.

IBM Log Analysis with LogDNA

IBM Cloud Log Analysis with LogDNA enables you to quickly find the source of issues and gain deeper insight into application and cloud environment data. IBM Cloud logging begins with log aggregation from application and services within IBM Cloud. IBM partners with LogDNA to bring collection, log tailing and blazing fast log search. LogDNA supports integrations to many cloud-native runtimes and environments.

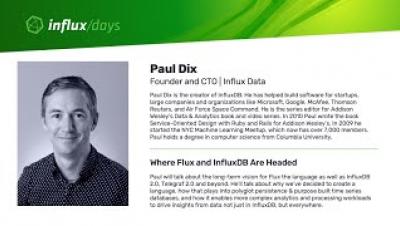
Paul Dix [InfluxData] | Where Flux and InfluxDB Are Headed | InfluxDays SF 2019

Paul will talk about the long-term vision for Flux the language as well as InfluxDB 2.0, Telegraf 2.0 and beyond. He’ll talk about why we’ve decided to create a language, how that plays into polyglot persistence & purpose-built time series databases, and how it enables more complex analytics and processing workloads to drive insights from data not just in InfluxDB, but everywhere.

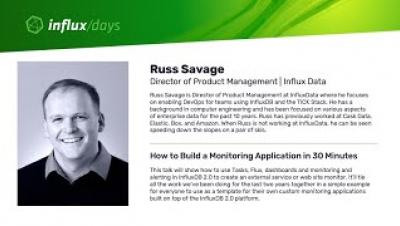
Russ Savage[InfluxData] | How to Build a Monitoring Application in 30 Minutes | InfluxDays SF 2019

This talk will show how to use Tasks, Flux, dashboards and monitoring and alerting in InfluxDB 2.0 to create an external service or website monitor. It’ll tie all the work we’ve been doing for the last two years together in a simple example for everyone to use as a template for their own custom monitoring applications built on top of the InfluxDB 2.0 platform.

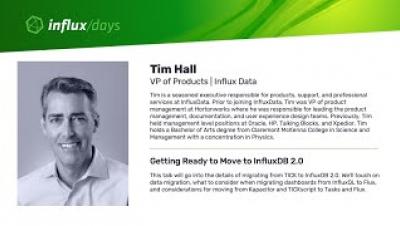
Tim Hall [InfluxData] | Getting Ready to Move to InfluxDB 2.0 | InfluxDays 2019

This talk will go into the details of migrating from TICK to InfluxDB 2.0. We’ll touch on data migration, what to consider when migrating dashboards from InfluxQL to Flux, and considerations for moving from Kapacitor and TICKscript to Tasks and Flux.

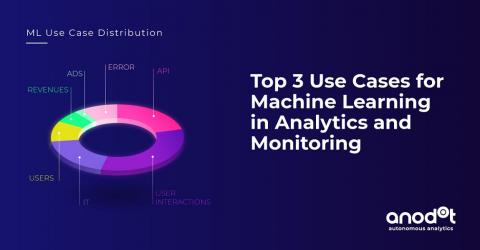
The Top 3 Use Cases for Machine Learning in Analytics and Monitoring

It’s no secret that machine learning (ML) has experienced tremendous growth and adoption over the last few years. And why not? This exciting technology has enabled us to utilize the power of machines for a wide variety of applications and industries. From image processing to predicting to medical diagnosis, ML has begun to reshape the way we live.