Operations | Monitoring | ITSM | DevOps | Cloud

Analytics

The Top 10 DevOps Trends of 2019

At Logz.io we’re always keeping tabs on the latest and greatest in the DevOps world, for the benefit of both our own engineering team and for the teams that use our products. As the days get shorter and colder, we decided to look back on 2019 and share the top trends we’ve seen in 2019 so far. The acronym “CALMS” (Culture, Automation, Lean, Measurement, Sharing) is a helpful way to structure thinking about DevOps tools and techniques.

Screens Beta

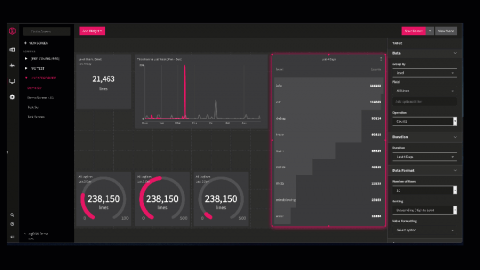
Screens display a series of widgets that you can use to share across your organization. Widgets can display your log activity, from the number of logs ingested in the last 4 hours, to a line graph comparing today’s logs to yesterday’s logs. You can control the data you want to display by creating a “Screen” with a combination of different widgets. Post your screen on a company monitor to provide your organization with a snapshot of your system’s activity.

T-Mobile's New Mobile App is Powered by Elasticsearch

T-Mobile is one of the leading mobile phone providers. Its mobile app for Android and Apple iOS is powered by Elasticsearch. Ever since T-Mobile rolled out its new app, rebuilt from the ground up, the app's customer ratings have skyrocketed while at the same time the app has become a marketing bonanza for T-Mobile.

Integrating Time Series Correlation to Accelerate Root Cause Analysis

In any platform of sufficient complexity, multiple anomalies are likely to occur. For many organizations, NOC operators triage multiple anomalies based on their severity. There are internal, non-customer-facing issues that might affect only a small part of your workforce and one-time issues that affect only a small number of customers. Both of the issues get ticketed and sent to low-level support.

Aggregating logs with Graylog - A quick how-to guide

Graylog’s log aggregation features are useful for a lot of tasks, ranging from regular troubleshooting to detecting issues as soon as they become manifest. Optimizing log management by aggregating all meaningful data is a quick and efficient way to isolate any problem to root causes and solve it with minimal impact on services. Aggregated data is easier to parse and analyze – you can reduce the number of data points in a meaningful way and obtain the answer you need from them.

Real-Time Analytics for Time Series

Let’s start with simple definitions. Time series data is largely what it sounds like – a stream of numerical data representing events that happen in sequence. One can analyze this data for any number of use cases, but here we will be focusing on two: forecasting and anomaly detection. First, you can use time series data to extrapolate the future.

Adtech Leader Natural Intelligence Now Resolving Glitches in Minutes Rather than Days

Natural Intelligence runs comparison websites that generate millions in ad traffic. A glitch could easily cost the company thousands in ad revenue. VP R&D Lior Schachter shares the difference Anodot’s real-time analytics, with machine learning anomaly detection, has made across the company.

LogDNA and IBM find synergy in cloud

You know what they say: you can’t fix what you can’t find. That’s what makes log management such a critical element in the DevOps process. Logging provides key information for software developers on the lookout for code errors. While working on their third startup in 2013, Chris Nguyen and Lee Liu realized that traditional log management was wholly inadequate for addressing data sprawl in the modern, cloud-native development stack.

How to Monitor Amazon Redshift

In the first post of our three-part Amazon Redshift series, we covered what Redshift is and how it works. For the second installment, we’ll discuss how Amazon Redshift queries are analyzed and monitored. Before we go deep into gauging query performance on Redshift, let’s take a quick refresher on what Amazon Redshift is and what it does.