Operations | Monitoring | ITSM | DevOps | Cloud

Dashboards

Grafana 10.1 release: Enhanced flame graphs, new geomap network layer, and more

Grafana 10.1 is here! The latest Grafana release introduces new features and improvements that help deepen your observability insights in Grafana, including an improved flame graph, a new geomap network layer, simplified alerting workflows, and more. Grafana 10.1: Download now! For an overview of all the features in this release, check out our What’s New documentation. And to learn the details about all the Grafana 10.1 updates, read our changelog for more information.

Grafana k6 v0.46.0 release: TLS per gRPC connection support, new usage reports in Grafana Cloud k6, and more!

Grafana k6 v0.46.0 is here! The new release features the ability to configure TLS, new usage reports and PDF reports in Grafana Cloud, and tons of improvements for Grafana k6 OSS and Grafana Cloud k6. Here’s an overview of Grafana k6 v0.46.0, as well as some other important updates from the k6 team and community.

How we scaled Grafana Cloud Logs' memcached cluster to 50TB and improved reliability

Grafana Loki is an open source logs database built on object storage services in the cloud. These services are an essential component in enabling Loki to scale to tremendous levels. However, like all SaaS products, object storage services have their limits — and we started to crash into those limits in Grafana Cloud Logs, our SaaS offering of Grafana Loki.

Dashboard Stories: Gamified bug bash tracking

We love a ‘bug bash’ here at SquaredUp, so we regularly encourage our developers and testers to down tools on major features to go after smaller issues that have been 'bugging' them. This dashboard helps us measure the success of the teams latest bug bash and adds a little gamification for some competitive fun! Using the Jira plugin in SquaredUp, we can stream our data on demand into this centralized dashboard for the whole team. Now we can easily see how we're doing against our target, without having to trawl through Jira.

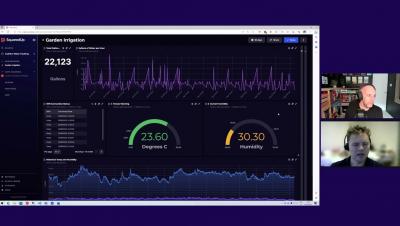
Dashboard Stories: Observing Garden Irrigation water usage with SQL

This useful garden irrigation dashboard built in SquaredUp displays a series of data on system availability, water usage and weather conditions. Using the SQL plugin, it pulls data from the Arduino device, allowing me to quickly visualize water usage across any timeframe I choose. This means that I can spot irregularities in usage, which could indicate a leak. I chose to use SquaredUp dashboards for this project, as even though I’m only working with simple data, once you surface it there’s a lot you can do with it!

Dashboards & Reports for New-Age Observability with DX UIM from Broadcom

In this 10-minute how-to video, 2nd in a series, learn more about DX UIM for new-age infrastructure observability. Watch to learn about inventory view and grouping, creating metric view dashboards and reports, Performance Reports Designer, List View Designer, and a sneak peek at a unified view.

Less is more: How Grafana Mimir queries run faster and more cost efficiently with fewer indexes

Over the past six months, we have been working on optimizing query performance in Grafana Mimir, the open source TSDB for long-term metrics storage. First, we tackled most of the out-of-memory errors in the Mimir store-gateway component by streaming results, as we discussed in a previous blog post. We also wrote about how we eliminated mmap from the store-gateway and as a result, health check timeouts largely disappeared.

Monitoring machine learning models in production with Grafana and ClearML

Victor Sonck is a Developer Advocate for ClearML, an open source platform for Machine Learning Operations (MLOps). MLOps platforms facilitate the deployment and management of machine learning models in production. As most machine learning engineers can attest, ML model serving in production is hard. But one way to make it easier is to connect your model serving engine with the rest of your MLOps stack, and then use Grafana to monitor model predictions and speed.

Grafana vs. SolarWinds - The Dashboards

Dashboards are great ways to visualize different KPIs in a single place. Metrics from all over your system can be framed together and viewed on a single screen, helping to correlate them and reducing the overall effort of analysis. But when it comes to Grafana vs. SolarWinds, which one is better? It is often difficult to choose between their dashboarding capabilities. Both tools provide their own visualizations and help bring out interactive dashboards for users to use.

Using DX NetOps Dashboards To Harness the Power of AppNeta Data

In today’s dynamic, complex network environments, there’s a big difference between having monitoring data and having intelligence. To troubleshoot issues quickly, it’s vital to have timely, intuitive visibility into the metrics that matter. With the combination of AppNeta and DX NetOps, teams can gain the insights they need to efficiently and intelligently manage their environments.