Operations | Monitoring | ITSM | DevOps | Cloud

Dashboards

Grafana vs. SolarWinds - The Dashboards

Dashboards are great ways to visualize different KPIs in a single place. Metrics from all over your system can be framed together and viewed on a single screen, helping to correlate them and reducing the overall effort of analysis. But when it comes to Grafana vs. SolarWinds, which one is better? It is often difficult to choose between their dashboarding capabilities. Both tools provide their own visualizations and help bring out interactive dashboards for users to use.

Using DX NetOps Dashboards To Harness the Power of AppNeta Data

In today’s dynamic, complex network environments, there’s a big difference between having monitoring data and having intelligence. To troubleshoot issues quickly, it’s vital to have timely, intuitive visibility into the metrics that matter. With the combination of AppNeta and DX NetOps, teams can gain the insights they need to efficiently and intelligently manage their environments.

Reduce MTTR with Grafana, Grafana k6, and Prometheus: Inside DHL's observability stack

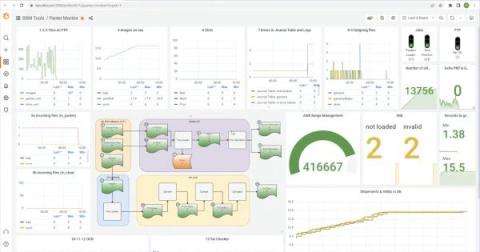
Each year, more than 296 million packages are shipped around the world via DHL and their premium service, Time Definite International. And at DHL Express Switzerland, a local unit of the international logistics and shipping company, the IT team provides solutions for tracking customs clearance progress, analytics, mobile and optical character recognition (OCR) scanning, and warehouse management on every package that moves through Switzerland.

Dashboards, Metrics & Alerts management in SigNoz

More about SigNoz: SigNoz - Monitor your applications and troubleshoot problems in your deployed applications, an open-source alternative to DataDog, New Relic, etc. Backed by Y Combinator. SigNoz helps developers monitor applications and troubleshoot problems in their deployed applications. SigNoz uses distributed tracing to gain visibility into your software stack. If you need any clarification or find something missing, feel free to raise a GitHub issue with the label documentation or reach out to us at the community slack channel.

How to monitor pool water levels from anywhere with Grafana

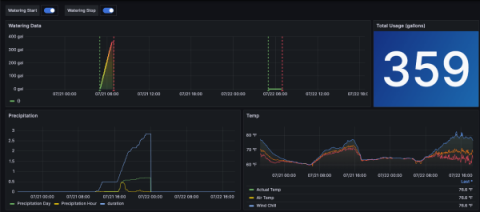
I’ve had a swimming pool at my house in Massachusetts since 2016. One of the problems that pool owners like myself face when we go on vacation or leave for several days is evaporation from the pool and the water level dropping below the skimmers. This can happen due to sunlight and warm temperatures. It can also happen when temperatures drop at night and the pool is being heated — the water temperature is warmer than the air, causing the water to evaporate.

What's new in k6 browser? (k6 Office Hours #98)

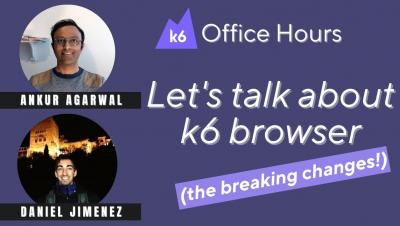
k6 browser adds browser-level APIs to automate browser actions and collect web performance metrics as part of your k6 test. It's an experimental module, and there is a good reason why! In this k6 Office Hours, Developer Advocates Marie Cruz and Nicole van der Hoeven are joined by Software Engineers Ankur Agarwal and Daniel Jimenez to discuss the breaking changes that are about to come to k6 browser! You wouldn't want to miss this.

How Qonto used Grafana Loki to build its network observability platform

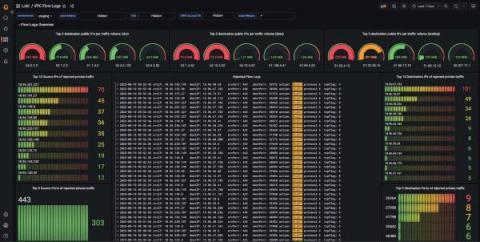
Christophe is a self-taught engineer from France who specializes in site reliability engineering. He spends most of his time building systems with open-source technologies. In his free time, Christophe enjoys traveling and discovering new cultures, but he would also settle for a good book by the pool with a lemon sorbet.

Understanding Grafana k6: A simple guide to the load testing tool

Grafana k6 is a powerful, developer-friendly tool designed and engineered with a focus on load testing — but it boasts capabilities that extend far beyond that use case. Understanding the inner workings of k6 is helpful to fully leverage its potential, and to tailor the tool to your specific testing needs. Read on to learn how k6 is structured, and how its underlying design provides the best possible reliability and load testing experience.

Unify your observability signals with Grafana Cloud Profiles, now GA

Observability has traditionally been conceptualized in terms of three core facets: logs, metrics, and traces. For years, these elements have been seen as the “pillars” of observability, serving as the foundational components for system monitoring and delivering key insights to improve system performance. However, with the exponential growth in system complexity, a more comprehensive and unified perspective on observability has become necessary.