Operations | Monitoring | ITSM | DevOps | Cloud
DevOps
The latest News and Information on DevOps, CI/CD, Automation and related technologies.
AWS Secrets Manager
Last week, at the AWS Summit San Francisco, AWS unveiled the new AWS Secrets Manager service. This new service allows you to: Save your secrets, passwords, and API keys in a KMS-encrypted storage service, Retrieve your secrets from your applications using the AWS CLI and AWS SDKs, and Automatically rotate your secrets on a custom schedule.
4 Metrics to Monitor When Scaling Up and Down in the Cloud
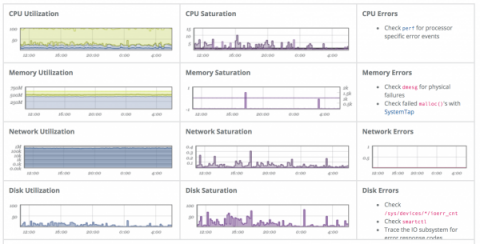
Due to its highly scalable nature, monitoring cloud computing is different from monitoring on-premise servers. The cloud vendor may have tools you can use, but if they fall short of your monitoring requirements you need to seek alternative solutions. Discover the right monitoring tools for your situation.
3 Ways that Continuous Delivery and Incident Response Enable Fast Feedback
One of the most impressive books on DevOps, “The DevOps Handbook”, emphasis three fundamental principles underpinning DevOps: systems thinking, amplify feedback loops, and continual experimentation & learning. Amplifying feedback loops is described as creating the right to left feedback loops, which helps corrections to be made continually, by Gene Kim in his blog post. But, let’s start with why we should do this in the first place.
Six easy steps for migrating to Azure
Tailor alarm content to your specific needs using Alarm Modifier
DevOps teams use a number of monitoring, project management, log management, and other IT management tools to receive alerts when something’s up. While this helps IT teams keep their system up and running at all times, the content of the alerts sent by some applications might not be relevant or insightful to the technicians who work on those issues. Now, with the Alarm Modifier feature, you can add new fields to an alarm, modify existing fields, rename fields, or remove them altogether.
SREcon 2018 Americas
Getting paged at 11pm on New Year’s Eve because the application code used sprintf %d on a 32 bit system and your ids just passed 4.295 billion, sending the ids negative and crashing your object service. A wakeup call at 2 am (or is it 3 am?) on the ‘spring forward’ Daylight Savings transition because your timezone libraries didn’t incorporate one of the several dozen new politically mandated timezone changes.
Docker Swarm isn’t dead
How I used Swarm to rearchitect a monolith. Some decisions take time to make. Should I learn Golang or Elixir? Should I use Docker Swarm or Kubernetes? You start by learning Docker, then you outgrow it when you want to deploy an app on more than one server. But you must choose between Swarm and k8s…
Icinga Camp Berlin 2018 - Dev and Ops stories: Integrations++
Top Deployment Tools for 2018
Deployment errors can be expensive mistakes. Successful development teams understand that their deployment tools must help structure and organize updates in a systematic and safe way. Regardless of your team’s preferred programming language, these tools can help. Discover the best tools for deployment.


