Operations | Monitoring | ITSM | DevOps | Cloud

Blog

5 important features to look for in cybersecurity applications

In today’s digital landscape, organizations need the right cybersecurity applications to address evolving cyber threats effectively. To keep security teams aligned and streamline mission-critical workflows, one of the most important cybersecurity applications organizations need is a secure and efficient cybersecurity collaboration platform that enables seamless communication, information sharing, and coordinated incident response.

Grafana Cloud Free: Actual stories about our 'actually useful' hosted free tier

It’s no secret that anyone can download our open source software and run it, because — once more with feeling — open source is in our DNA. But it can be hard to set up and configure a whole stack from scratch, which is why we offer Grafana Cloud as a fully managed observability platform.

Why you need an internal status page

When we launched incident.io Status Pages a few months ago, we stressed the importance of communicating clearly with your customers about ongoing issues. To help with this, we spent a lot of time carefully designing a status page that’s easy to understand for everyone - whether they come from a technical background, work in a different area, or just want to get on with their day.

Exploring AKS networking options

At Kubecon 2023 in Amsterdam, Azure made several exciting announcements and introduced a range of updates and new options to Azure-CNI (Azure Container Networking Interface). These changes will help Azure Kubernetes Services (AKS) users to solve some of the pain points that they used to face in previous iterations of Azure-CNI such as IP exhaustion and big cluster deployments with custom IP address management (IPAM).

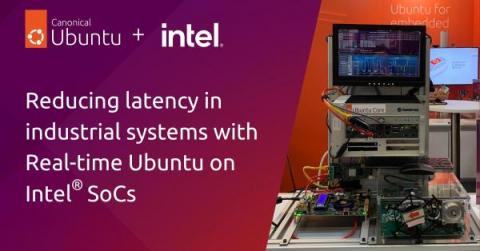
Reducing latency in industrial systems with real-time Ubuntu on Intel SoCs

Delivering a comprehensive real-time solution for industrial systems requires careful work at every layer of the stack. Since standalone hardware or software components are not sufficient, Canonical and Intel have joined forces to deliver an out-of-the-box real-time solution. This solution is now generally available on Intel Core processors.

Prometheus Monitoring 101

Prometheus is an increasingly popular tool in the world of SREs and operational monitoring. Based on ideas from Google’s internal monitoring service (Borgmon), and with native support from services like Docker and Kubernetes, Prometheus is designed for a cloud-based, containerized world. As a result, it’s quite different from existing services like Graphite. ‍ Starting out, it can be tricky to know where to begin with the official Prometheus docs and the wave of recent Prom content.

Why we generate & collect logs: About the usability & cost of modern logging systems

Logs and log management have been around far longer than monitoring and it is easy to forget just how useful and essential they can be for modern observability. Most of you will know us for VictoriaMetrics, our open source time series database and monitoring solution. Metrics are our “thing”; but as engineers, we’ve had our fair share of frustrations in the past caused by modern logging systems that tend to create further complexity, rather than removing it.

Connecting Prometheus and Grafana

Using Prometheus and Grafana together is a great combination of tools for monitoring an infrastructure. In this article, we will discuss how Prometheus can be connected with Grafana and what makes Prometheus different from the rest of the tools in the market. MetricFire's product, Hosted Graphite, runs Graphite (a Prometheus alternative) with Grafana dashboards for you so you can have the reliability and ease of use that is hard to get while doing it in-house.