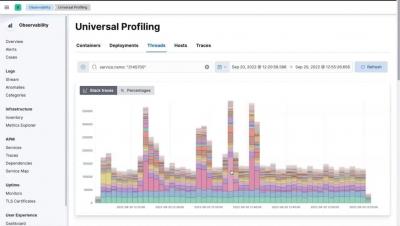
So, what is Universal Profiling™? Universal Profiling™ is fast emerging as an important component of observability. A standard feature inside hyperscalers since approximately 2010, the technology is slowly percolating into the wider industry. Universal Profiling™ allows you to see what your code is doing all the time, in production across a wide range of languages and can profile both user-space and kernel-space code.
Elastic continues to help everyone find what they need faster with Elastic Enterprise Search, a comprehensive solution for building search-powered applications. Elastic Enterprise Search elevates relevance and precision at scale with a new combination of traditional and machine learning-assisted techniques.
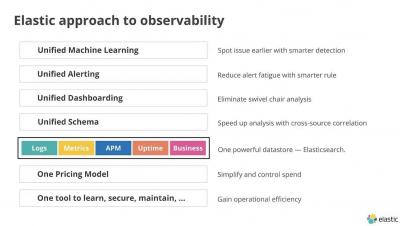
From its inception as a powerhouse for logging, Elastic Observability has grown into a comprehensive solution for full-stack multi and hybrid-cloud observability. Given the increasing complexity of the cloud-native world, the major challenge for observability is twofold: getting deeper and more frictionless visibility at all levels of applications, services, and infrastructure, and making sense of the overwhelming amount of data that is available.
September is here, and that means many retailers have already begun preparing for the upcoming holiday season. One weekend in particular tends to be the real-life stress test that companies have come to develop a love-hate relationship with: Cyber Weekend. Or more specifically, Black Friday, Cyber Monday, and the weekend in between.
Search is the key to improving the customer experience–and business outcomes Retailers that weathered the global pandemic now face new challenges: emerging shopping patterns, competitive upstarts, and economic uncertainty.
Artificial Intelligence for IT Operations (or AIOps for short) continues to be a hot topic among developers, SREs, and DevOps professionals. The case for AIOps is especially crucial given the expansive nature of today’s observability efforts across hybrid and multi-cloud environments. As with most observability platforms, it all starts with your telemetry data: metrics, logs, traces, and events.
As a DevOps engineer or SRE, you are often faced with investigating complex problems — mysterious application performance issues that happen intermittently or to only certain portions of your application traffic — that impact your end users and potentially your company’s financial targets. Sifting through hundreds or even thousands of transactions and spans can be a lot of tedious, manual, and time consuming investigative work.
Microsoft Azure’s recently launched new Azure Virtual Machines (VMs) feature the Ampere Altra Arm-based processor. These new VMs are engineered to efficiently run horizontally scalable workloads such as web servers, application servers, and open source databases. They deliver excellent price-performance and represent an important addition to Microsoft Azure's portfolio of instance types.