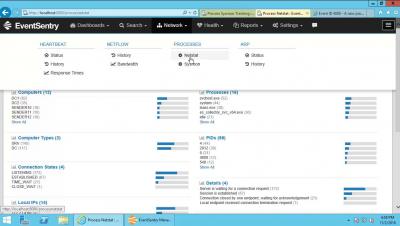
This week we highlight Grafana project contributors from Hacktoberfest, share an article we published earlier this week on monitoring devices in your home with Prometheus and Grafana, how SoftwareMill manages their dashboards across environments and more.
While the term ‘Java troubleshooting’ can apply to many, many scenarios, this post focuses on three particular long-standing Java production scenarios: a denial of service to a Java service endpoint, a memory leak, and troubleshooting a thread deadlock or race condition. Follow along as we use Java inside Docker containers to facilitate quick testing and show you how to use open source sysdig to quickly diagnose each troubleshooting scenario.
This article is a continuation of Deploying JFrog Artifactory with Rancher. In this chapter we'll demonstrate how to use JFrog Artifactory as a private repository for your own Docker images.
What is log monitoring and log analysis? Both are crucial parts of log management and related in many capacities, but by definition, the two actually have different core meanings.
Sure, thousands of technologists around the world are using Prometheus and Grafana to monitor their business systems. But how about putting these technologies to work at home? Erwin de Keijzer, a Linux engineer at the Dutch consulting firm Snow, gave a talk at GrafanaCon EU about how he used Prometheus and Grafana to monitor the power usage… of his washing machine. “This is a talk that’s a bit different scale than we’ve heard so far” at GrafanaCon, he quipped.
Addressing compliance requirements for monitoring and logging can be a challenge for any organization no matter how experienced or skilled the people responsible are. Compliance requirements are often not well understood by technical teams and there is not much instruction on how to comply with a compliance program. In this article, we’ll discuss what some of these new compliance programs mean, why they are important, and how you can comply with your logging and monitoring system.
Amazon Elastic Beanstalk allows you to quickly provision the infrastructure needed for an entire application without the hassle of managing the configuration of EC2 instances, Elastic Load Balancers, Auto Scaling, and many other AWS services. Elastic Beanstalk also automatically monitors these resources and provides a simplified view into your application’s health.