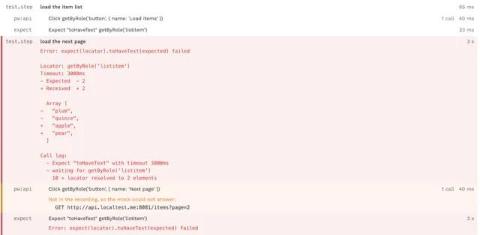
Your Playwright test clicks Next page, waits for the item list, and times out. Now you’re digging through a trace to find out whether the page broke or an API call failed. Traditional browser-testing workflows focus on clicks, page state and UI assertions. Those checks tell you whether a user journey works, but investigating a failure also means understanding the APIs behind the page.
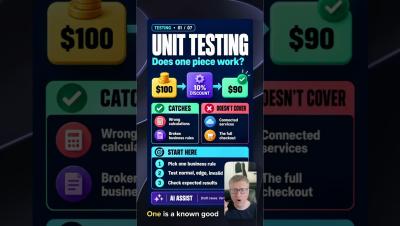
Learn what a unit test is, how AI coding assistants can write them for you, and the three key conditions every unit test should check to ensure software quality. Learn more: speedscale.com.
A monitoring dashboard can tell you a server is down. It may not tell you which services depend on it, what changed before the failure, or who should take the next step. Those gaps between systems, people, and processes are often what makes day-to-day IT operations difficult to manage. IT operations management software can help close those gaps, but the label covers very different kinds of products.
For a small practice, choosing an electronic health record system affects nearly every part of the working day: documenting visits, prescribing medications, reviewing results, scheduling appointments, and submitting claims. The right choice should fit your clinical specialty and the way your team operates.
Starting with Sentry Android SDK 8.51.0, profiling on Android 15+ devices is powered by Perfetto, through Android’s system ProfilingManager API. That means fewer legacy tracer crashes, lower CPU and memory overhead, and more representative profiles. You don’t need to change any configuration: if you already use continuous profiling, devices on Android 15 and newer pick up the new profiler as soon as you upgrade.
Agentic IT operations (Agentic ITOps) deploy autonomous AI agents that can perceive, reason, plan, and act to investigate incidents, coordinate people, and improve with every incident they touch. Think of it as the next step in a progression, where monitoring surfaced the symptoms, AIOps separated signal from noise, and Agentic ITOps takes action on what it finds.
The nature of cyber security is changing. In this video, I do a brief recap of a few of the compromises of the past couple weeks as well as highlight how our role as engineers is changing. Attackers have an easier time than ever in watching repos for changes to exploit 0-day vulnerabilities. But, it isn't all doom and gloom as long as we put in the effort. AI is creating a bit of an arms race between attackers and maintainers of sites and services, but there are actually more powerful tools available to defenders through exclusive programs like Daybreak, Glasswing, etc.
How do you trace a dropped conversion or a checkout failure to its technical root cause? See how full-stack observability in Grafana Cloud connects business impact to system performance across web and mobile clients, applications, infrastructure, and databases. In this session, Principal Software Engineer Jim Gehrett and Staff Product Manager Sarah Constant demonstrate how to start with a business problem and work backward through the technology stack to investigate its cause.
How does Uber use continuous profiling to improve performance and resource efficiency across several million CPU cores? In this Grafana Cloud case study, Senior Researcher Chris Zhang from Uber’s Frontier Tech Labs explains how the team uses Grafana Cloud Profiles and Grafana Assistant to identify expensive code and scale code optimization across its production systems.