Operations | Monitoring | ITSM | DevOps | Cloud
Coralogix
Microservices Testing Strategies and Tools
Microservices testing is an essential part of any DevOps strategy. In a fast-paced environment like DevOps, you need real-time data on the deployment status and ensure your microservices integrations work correctly. The best way to achieve this is with frequent microservices testing.
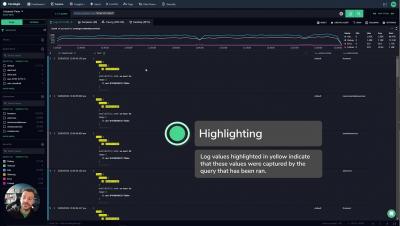
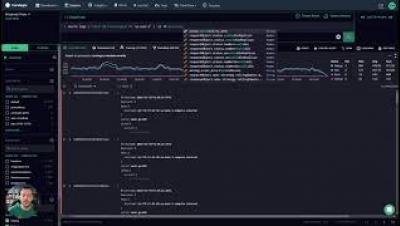
Coralogix Deep Dive - The Basics of the Logging Interface
Importing your Cloudwatch Metrics into Prometheus
Cloudwatch is the de facto method of consuming logs and metrics from your AWS infrastructure. The problem is, it is not the de facto method of capturing metrics for your applications. This creates two places where observability is stored, and can make it difficult to understand the true state of your system. That’s why it has become common to unify all data into one place, and Prometheus offers an open-source, vendor-agnostic solution to that problem.
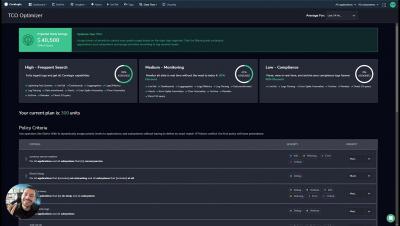
Save 40-70% of Your Observability Costs with Coralogix TCO
Just Some of the AMAZING things You Can Do with DataPrime
Why EVERYONE Needs DataPrime
In modern observability, Lucene is the most commonly used language for log analysis. Lucene has earned its place as a query language. Still, as the industry demands change and the challenge of observability grows more difficult, Lucene’s limitations become more obvious.
Connecting OpenTelemetry to AWS Fargate
OpenTelemetry is an open-source observability framework that provides a vendor-neutral and language-agnostic way to collect and analyze telemetry data. This tutorial will show you how to integrate OpenTelemetry with Amazon AWS Fargate, a container orchestration service that allows you to run and scale containerized applications without managing the underlying infrastructure.
Fintech APM: Considerations, Benefits, and Tools
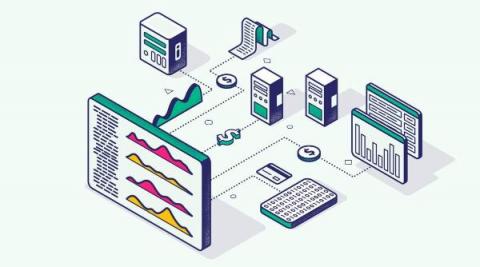
In the last few years, fintech enterprises have disrupted the financial services and banking industry by taking everything computing technology offers – from machine learning to blockchain – and turning it up a notch. Traditional financial institutions must now compete with challenger banks offering electronic payment alternatives, peer-to-peer lending, and investment apps.
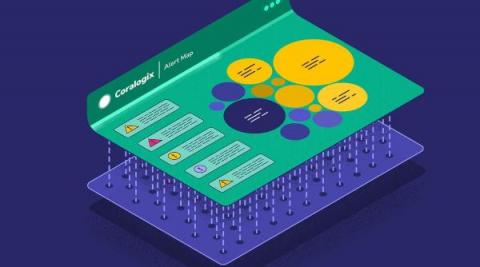
Thousands of Insights at a Glance With Coralogix Alert Map
An effective alerting strategy is the difference between reacting to an outage and stopping it before it starts. That’s why at Coralogix, we’re constantly releasing new features that redefine how alerts are consumed, to enable teams to push their ambitions even further, release with confidence, and tackle issues proactively. Alerts Map is now an indispensable tool for that mission.


