Operations | Monitoring | ITSM | DevOps | Cloud

Grafana

timeShift(GrafanaBuzz, 1w) Issue 81

TimeShift is back after a few weeks away with a lot of updates to share. Nearly all of the Videos and presentations from GrafanaCon LA are available, so please check them out and let us know what you think. Also, if you hadn’t heard, Grafana v6.0 stable was recently released which has lots of new features and enhancements. Download the latest version v6.0.1 and read about the highlights below.

How New City Energy Is Supporting Sustainability with Grafana

Grafana isn’t just being used for monitoring applications. Andrew Rodgers, Senior Systems Architect at New City Energy, spoke in Amsterdam at GrafanaCon EU 2018 about how his organization is using Grafana to measure energy usage in municipal buildings in Washington D.C. for the Department of General Services (DGS).

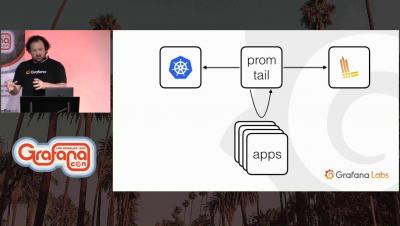
Observing Kubernetes: Lessons learned building, managing & monitoring cloud native systems

This talk covers experience and thoughts about how to approach the monitoring and management of cloud-native systems. It will draw both from observations of the opportunities provided by systems like Kubernetes as well as from practical hands-on experience from building real monitoring systems. With luck it will provide both experiences from the past, and inspirations for the future.

Sensu Check Metric Extraction with InfluxDB and Grafana

Nikki Attea talks about one of the endless permutations of metrics software you can pair with Sensu. She'll show you how to collect data using Sensu check output metric extraction, transform that data with a Sensu InfluxDB Handler, store the data in an InfluxDB time series database and visualize that data on a Grafana dashboard.