Operations | Monitoring | ITSM | DevOps | Cloud
Grafana
How Not to Fail at Data Visualization
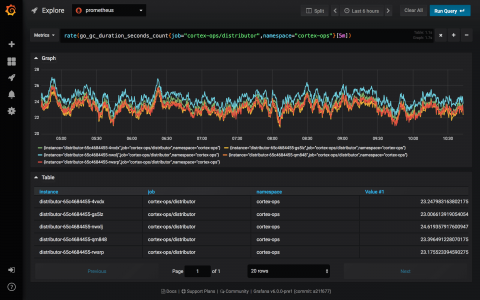
Grafana v6.0 Released
v6.0 Stable released! GrafanaCon LA is underway! Check out the live stream on the Grafana youtube channel. I am proud to announce that we are releasing Grafana v6.0 stable today. Before every major release I feel super excited about the progress that has been made and with this release, this is especially true.
timeShift(GrafanaBuzz, 1w) Issue 80
We only have a handful of general admission tickets to GrafanaCon LA before angel tickets go on sale, but you still have time to grab one of the last remaining GA tickets. We’re really excited how the schedule has shaped up and hope you can join us!
timeShift(GrafanaBuzz, 1w) Issue 79
Time is running out to get your ticket to GrafanaCon LA, but you can still grab one of the last remaining seats. We’re really excited how the schedule has shaped up and hope you can join us!
timeShift(GrafanaBuzz, 1w) Issue 78
Grafana v6.0 Beta1 was released this week, and it’s packed with new features! This is one of the biggest updates to Grafana and introduces a new way to explore your data, support for log data, and includes tons of other enhancements. We hope you’ll give v6.0 Beta1 a try and let us know what you think. You can see a few of the highlights below, but check out all of the updates in the What’s new in Grafana v6 documentation.
timeShift(GrafanaBuzz, 1w) Issue 77
We’ve added more info on the upcoming talks at GrafanaCon LA and are excited to see the schedule shaping up. Grab your ticket while the last and join us February 25-26 for two days of great talks and hands-on workshops. This week we’re happy to share articles on how to view Azure Monitor Log Analytics data in Grafana, a proof of concept to visualize Fitbit data, how to quickly get up and running with Prometheus and more.
timeShift(GrafanaBuzz, 1w) Issue 76
This week we share news about the Azure Data Explorer plugin for Grafana, updates to the GrafanaCon LA speaker list, new functionality added to the polystat panel plugin and more.
timeShift(GrafanaBuzz, 1w) Issue 75
We’ve been busy updating the GrafanaCon LA website, with additional speakers and are adding more every day, so please stay tuned. Don’t miss your chance to get your ticket. We also have tons of plugin updates to share this week and 2 brand new plugins to check out.
Moving to packages.grafana.com
To make it even easier for you to get the debian and rpm packages you need we’re moving to our own repository. The previous repository over at packagecloud will stop working on the 7th of January 2019 and you will have to update your configurations for updates to work.


