Operations | Monitoring | ITSM | DevOps | Cloud

Grafana

timeShift(GrafanaBuzz, 1w) Issue 74

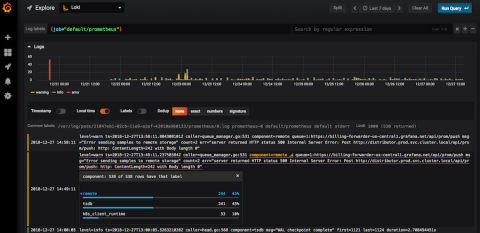
Happy New Year! We hope you had a relaxing and safe holiday season, but now it’s time to get back to work! This week we share articles on the UX of Loki, visualizing pull request data from BitBucket, monitoring and observability predictions for 2019 and more! Also, we’ll be making some exciting announcements for GrafanaCon in the coming days, so stay tuned and get your ticket now!

timeShift(GrafanaBuzz, 1w) Issue 72

The Grafana Labs team converged on Seattle this week for KubeCon + CloudNativeCon NA 2018 where we announced a new Prometheus-inspired, open source logging project we’ve been working on named Loki. We’ve been overwhelmed by the positive response and conversations it’s sparked over the past few days. Please give it a try on-prem or in the cloud and give us your feedback. You can read more about the project, our motivations, and check out the presentation in the blog section below.

Pro Tips: Using Grafana in Quality Assurance

Quality assurance is a priority at Evolution Gaming, the world leader in live casino gaming, and as Andrejs Kalnacs, Lead Software Developer in Test, said during his GrafanaCon EU talk in March, Grafana has been a game changer. While Kalnacs and his team have found Grafana to be invaluable in many areas, here are three best practices they’ve learned throughout their journey.