Operations | Monitoring | ITSM | DevOps | Cloud
Tracing
The latest News and Information on Distributed Tracing and related technologies.
Understanding APM: How to add extensions to the OpenTelemetry Java Agent
As an SRE, have you ever had a situation where you were working on an application that was written with non-standard frameworks, or you wanted to get some interesting business data from an application (number of orders processed for example) but you didn’t have access to the source code?
How we slashed detection and resolution time in half (Salt Security)
Salt Security had deployed OpenTelemetry but found it insufficient. So the company engineers evaluated Helios, which visualizes distributed tracing for fast troubleshooting. My role as the Director of Platform Engineering at Salt Security lets me pursue my passion for cloud-native tech and for solving difficult system-design challenges. One of the recent challenges we solved had to do with visibility into our services. Or lack thereof.
Debugging and troubleshooting microservices in production-All you need to know
What do you do when things break in production? Debugging microservices isn’t a walk in the park. Microservices are designed to be loosely coupled, which makes them more scalable and resilient, but also more difficult to debug. When a problem occurs in a microservices app, it can be difficult to track down the source of the problem. When the problem is in production, the clock is ticking and you have to resolve the issues fast.
OpenMetrics vs OpenTelemetry - How to choose?
OpenTelemetry vs Prometheus
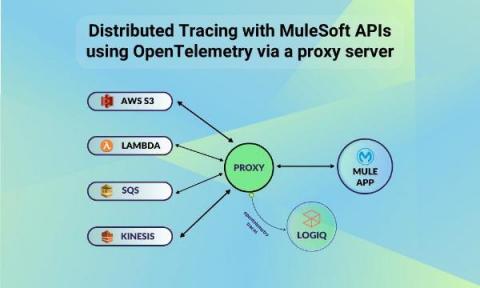
How to Instrument a Legacy Mule App with OpenTelemetry
In the previous article, we talked about Distributed Tracing with MuleSoft APIs using OpenTelemetry. In this post, we’ll go through the process of integrating Distributed Tracing with MuleSoft APIs using OpenTelemetry via a proxy server. The purpose of this article is to demonstrate how we can instrument a legacy mule app with open telemetry without making changes to the existing app. Here, we’re showing an example of getting data from a header as well as a query parameter.
What is OpenTelemetry Collector
What is OpenTelemetry Collector, Architecture, Deployment and Getting started.
Observing Core Web Vitals with OpenTelemetry
Core Web Vitals (CWV) are Google's preferred metrics for measuring the quality of the user experience for browser web apps. Currently, Core Web Vitals measure loading performance, interactivity, and visual stability. These are the main indicators of what a user’s experience will be while using a web page.
How to combine OpenTelemetry instrumentation with Elastic APM Agent features
Elastic APM supports OpenTelemetry on multiple levels. One easy-to understand scenario, which we previously blogged about, is the direct OpenTelemetry Protocol (OTLP) support in APM Server. This means that you can connect any OpenTelemetry agent to an Elastic APM Server and the APM Server will happily take that data, ingest it into Elasticsearch®, and you can view that OpenTelemetry data in the APM app in Kibana®.


