Operations | Monitoring | ITSM | DevOps | Cloud
Tracing
The latest News and Information on Distributed Tracing and related technologies.
OpenTelemetry Nginx Tutorial - Instrument and visualize traces
OpenTelemetry Architecture - Understanding the design concepts
Distributed Tracing: A Complete Guide
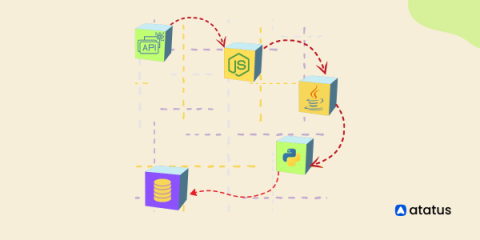
Any application you build has three distinct layers - a server-side interface, a client-side interface and the central codebase. In a monolith application, all these programs are written in a single language, and placed in the same web stack as well. Earlier web applications were written this way.
Introducing OpenTelemetry Support: Take Action on Your Observability Data
As an open source company that grew out of a side project in 2008 to an application and performance monitoring platform (APM) used by over 3.5 million developers, Sentry is committed to open source and the community of developers maintaining and building in the open. Similarly, we take a public approach to building our software, which is why it’s a natural extension of our values to announce our support for OpenTelemetry (or OTel), the leading open standard for observability.
How to achieve distributed tracing using Application Insights?
OpenTelemetry on AWS, beyond instrumentation and into resource attributes
Instrumenting your code is essential to understanding your system’s performance and diagnosing issues as they arise. Traditionally, this was accomplished using proprietary vendor libraries, causing major lock-in. Enter OpenTelemetry. OpenTelemetry is an open-source project that provides a set of APIs, SDKs, and integrations for instrumenting code.
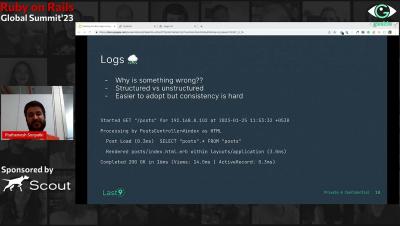
Peeking into Rails apps using OpenTelemetry
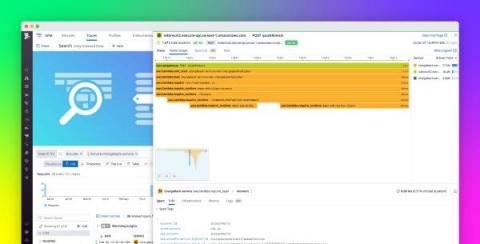
Understand serverless function performance with Cold Start Tracing
Serverless developers are undoubtedly familiar with the challenge of cold starts, which describe spikes in latency caused by new function containers being initialized in response to increasing traffic. Though cold starts are usually rare in production deployments, it’s still important to understand their causes and how to mitigate their impact on your workload.
Trace-based testing with Elastic APM and Tracetest
This post was originally published on the Tracetest blog. Want to run trace-based tests with Elastic APM? Today is your lucky day. We're happy to announce that Tracetest now integrates with Elastic Observability APM. Check out this hands-on example of how Tracetest works with Elastic Observability APM and OpenTelemetry! Tracetest is a CNCF project aiming to provide a solution for deep integration and system testing by leveraging the rich data in distributed system traces.


