Operations | Monitoring | ITSM | DevOps | Cloud
Tracing
The latest News and Information on Distributed Tracing and related technologies.
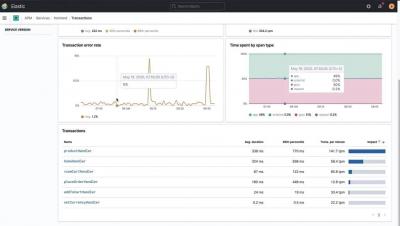
Understanding and Debugging Applications Using Traces
Collecting Kafka Performance Metrics with OpenTelemetry
In a previous blog post, "Monitoring Kafka Performance with Splunk," we discussed key performance metrics to monitor different components in Kafka. This blog is focused on how to collect and monitor Kafka performance metrics with Splunk Infrastructure Monitoring using OpenTelemetry, a vendor-neutral and open framework to export telemetry data. In this step-by-step getting-started blog, we will.
Two Quick Ways to Create Spans with Kamon Telemetry
If you already had some experience with Kamon, you probably saw Kamon create Spans automatically for a lot of stuff, including HTTP server requests, database calls, actor messages, and more. But what happens when you want to create Spans for methods or code blocks that Kamon doesn’t instrument automatically? Let’s look at the two simplest ways to create Spans programmatically with Kamon.
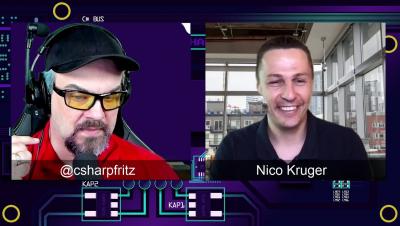
Error logging, tracing, and improving developer workflow with Jeffrey T. Fritz
Use Logz.io to Instrument Kubernetes with OpenTelemetry & Helm
Logz.io is always looking to improve the user experience when it comes to Kubernetes and monitoring your K8s architecture. We’ve taken another step with that, adding OpenTelemetry instrumentation with Helm charts. We have made Helm charts available before, previously with editions suitable for Metricbeat and for Prometheus operators.
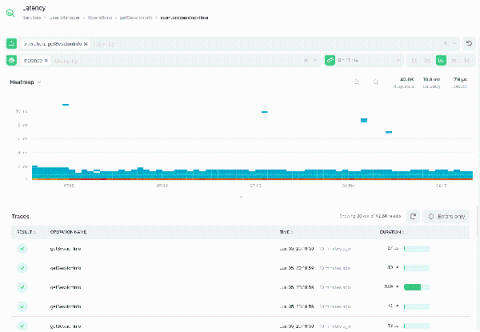
Is Distributed Tracing Really a Big Deal ?
What Is the OpenTelemetry Project and Why Is It Important?
The OpenTelemetry project is an ambitious endeavor with of goal of bringing together various technologies to form a vendor neutral observability platform. Within the past year, many of the biggest names in tech provide native support within their commercial projects.
Distributed Tracing vs. Application Monitoring
2 Ways to Integrate the Jaeger App with VMware Tanzu Observability Without Code Changes
In microservices architecture, to identify performance issues—including latency—it’s important to monitor each service and all inter-service communication. Jaeger and VMware Tanzu Observability can help. Jaeger is an open source, distributed tracing system released by Uber Technologies. VMware Tanzu Observability is a high-performance streaming analytics platform that supports 3D observability (e.g., metrics, histograms, and traces/spans).


