Operations | Monitoring | ITSM | DevOps | Cloud
Tracing
The latest News and Information on Distributed Tracing and related technologies.
Auto-instrumenting a Java Spring Boot application for traces and logs using OpenTelemetry and Grafana Tempo
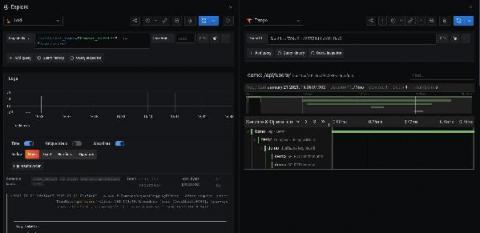
Auto-instrumentation is a subject I have not had much experience with. Here at Grafana Labs, we primarily develop in Go, which doesn’t afford such luxuries. However, there is an enormous amount of interest from the community in Java auto-instrumentation, so I set out to determine what was possible using the shiny new OpenTelemetry auto-instrumentation libraries.
Understanding and Debugging Applications Using Traces - Version 7.10
AWS Distro for OpenTelemetry - Now with Splunk Observability Support!
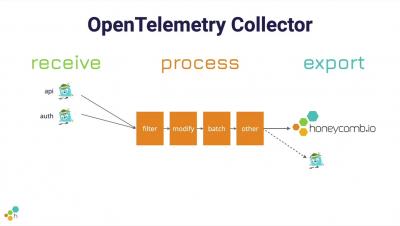
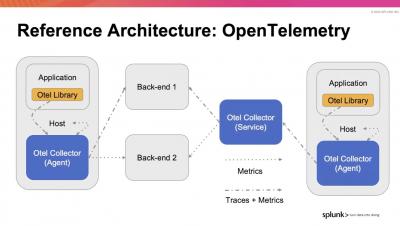
Back in October, we announced the Splunk OpenTelemetry Collector Distribution, which offered the industry’s first production-ready support for OpenTelemetry. This distribution is the recommended way that customers of Splunk’s award-winning observability products capture metrics and traces.
System Traceability: What is It and How Can You Implement It?
System traceability is one of the three pillars of observability stack. The basic concept of observability is of operations, which include logging, tracing, and displaying metrics. Tracing is intuitively useful. Identify specific points in an application, proxy, framework, library, runtime, middleware, and anything else in the path of a request that represents the following of either ‘forks’ in execution flow and/or a hop or a fan out across network or process boundaries.
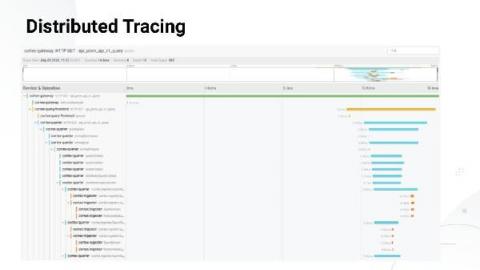
Logz.io Distributed Tracing Quick Demo
observIQ's Stanza Log Agent Now A Part of OpenTelemetry Project
Open Source in Application Monitoring
A beginner's guide to distributed tracing and how it can increase an application's performance
Most people are instrumenting their applications, with logs being an easy first step into the observability world, followed by metrics. Tracing lags behind these two and is maybe a little less used than other observability patterns. We hope to change that.


