Operations | Monitoring | ITSM | DevOps | Cloud

Tracing

The latest News and Information on Distributed Tracing and related technologies.

Beginner's Guide to Jaeger + OpenTracing Instrumentation for Go

This post aims to provide a very simple beginner’s guide to Jaeger + OpenTracing instrumentation for Go applications (the terms “application” and “service” is used interchangeably in this document) via a working example. If you are new to instrumentation, I recommend that you first read this post for a practical introduction to instrumentation for Jaeger and OpenTracing. You can also get more info on using logs in Go.

Jaeger Essentials: Introduction to Jaeger Instrumentation

Every journey in distributed tracing starts with instrumenting an application to emit or extract trace data from each service as they execute. There are many ways to instrument, including the use of SDKs and pre-configured frameworks, and many protocols for transmitting the trace data to the analysis tool.

Onboard your tracing data to Sumo Logic even faster with AWS OpenTelemetry distro (preview)

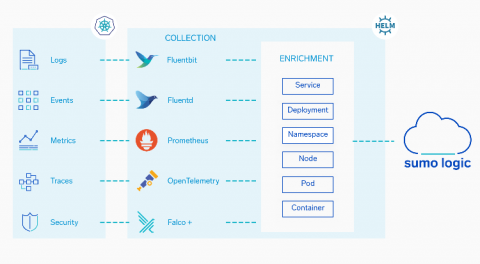
We at Sumo Logic believe in an open, flexible, community-driven approach to collecting observability data. Those reasons are outlined in one of my recent blogs. In that publication, I share the belief that an application’s observability gains traction from the fact that telemetry signals are designed, composed, and produced by an application developer/vendor in compliance with industry standards, and are not a proprietary, black box component of the monitoring vendor.

Mix & Match! Tracing Header Interoperability Between OpenTelemetry and Beelines

We’ve released support for tracing header interoperability in all of our Beelines. This means you can now mix and match distributed services instrumented with Beelines or with OpenTelemetry, and your traces will be preserved in Honeycomb!

Raw & Real Ep 7 The Tracing You Deserve So You Can Observe

Distributed tracing is key to building and operating reliable services that make your customers happy. Traces pinpoint where failures occur and what causes poor performance. With tracing and observability, you can visualize the entire life cycle of service requests and discover hidden latency, errors, and optimization opportunities monitoring can’t show you. So why doesn’t everybody do it? Setting up tracing is notoriously difficult, but it doesn’t have to be. Honeycomb Instrumentation Engineer Paul Osman has the easy-breezy steps for you to get the tracing you deserve.

Tracing with the Grafana Cloud Agent and Grafana Tempo

Back in March, we introduced the Grafana Cloud Agent, a subset of Prometheus built for hosted metrics. It uses a lot of the same battle-tested code as Prometheus and can save 40 percent on memory usage. Ever since the launch, we’ve been adding features to the Agent. Now, there’s a clustering mechanism, additional Prometheus exporters, and support for Loki. Our latest feature: Grafana Tempo! It’s an easy-to-operate, high-scale, and cost-effective distributed tracing system.

A 5 Minute Guide for Experimenting with Ambassador and Jaeger in a Kubernetes Sandbox

Implementing distributed tracing is fast becoming a fundamental expectation when building modern (distributed) systems. However, this is yet another thing for developers to learn, and configuring distributed tracing on Kubernetes is hard, right? Actually, no. Getting started with Jaeger on Kubernetes has never been easier.

An Introduction to our New Product: Logz.io Distributed Tracing

Yesterday we were excited to announce Logz.io Distributed Tracing, the most recent addition to our Cloud-Native Observability Platform. This is such a special launch for us because it makes Logz.io the only place where engineers can use the best open source monitoring tools for logs, metrics, and traces – known as the ‘three pillars’ to observability – together in one place.

User Experience Monitoring and Synthetics with Elastic Observability

Elastic Observability 7.10 introduces exciting new capabilities that bring deeper visibility into the most important layer of digital monitoring — the experience of the end user. User experience monitoring — accessed via a brand new app in Kibana — provides real-time visibility into website performance, and multistep journey checks in Uptime significantly expand synthetic monitoring capabilities to help operational teams proactively catch issues by monitoring simulated journeys. Plus, several new features like searchable snapshots, out-of-the-box anomaly detection jobs for infrastructure monitoring, and a PHP agent for Elastic APM help the Elastic Observability community optimize costs while deepening visibility across operations.

ScaleUP 2020 Recap: Introducing Distributed Tracing & More

Today was a monumental day for Logz.io and our entire community. There is nothing more inspiring than seeing how people use the technology we’ve built to enhance their businesses. At ScaleUP 2020, our first ever global user conference, we hosted an exciting day of technical, customer-led sessions with our community. We also had the privilege of unveiling some ground-breaking new solutions and enhancements to our end-to-end cloud-native observability platform.