Operations | Monitoring | ITSM | DevOps | Cloud

Tracing

The latest News and Information on Distributed Tracing and related technologies.

A Gem of an Update: Performance Monitoring for Ruby

In order to continuously improve your Ruby application, you need to understand everything your code touches. That means visibility into how your frontend responds to the database queries that are central to your Ruby application. Sentry’s new Ruby SDK collects and monitors the data surrounding your traces, logs, and key metrics. With it, you now have the context to connect backend issues to frontend performance.

How to get started quickly with metrics, logs, and traces using Grafana Cloud integrations

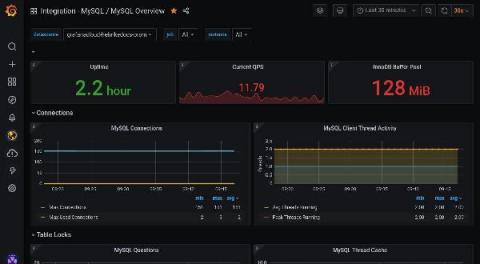
Grafana Cloud is the easiest way to get started observing metrics, logs, traces, and dashboards. When we say “easiest,” we mean it: Grafana Cloud is designed so that even novice observability users can use it. As a new user, you are not required to dive into the complexity of setting up Prometheus and figuring out how to create Grafana dashboards from scratch. Integrations are the reason why.

Embracing Open Source data collection

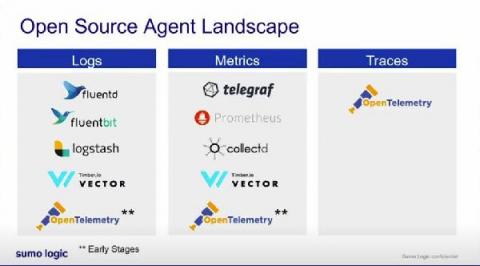
Open source has come a long way. One of my favorite reports on the subject is Red Hat’s State of Enterprise Open Source. For 2020, 95% of respondents said that open source is strategically important to their business needs. Here, I will be recapping my recent Illuminate presentation about embracing open source data collection and I thought it’s important to first talk about how open source has changed.

The new Grafana Cloud: the only composable observability stack for metrics, logs, and traces, now with free and paid plans to suit every use case

Oftentimes users of open source are told to go download it and figure it out… or pay for a managed solution in the cloud. So the typical choice is free and do-it-yourself or expensive and easy. With our new changes to Grafana Cloud, we are making it both free and easy to have a real, composable observability solution.

A Recap of the KubeCon + CloudNativeCon Observability Track

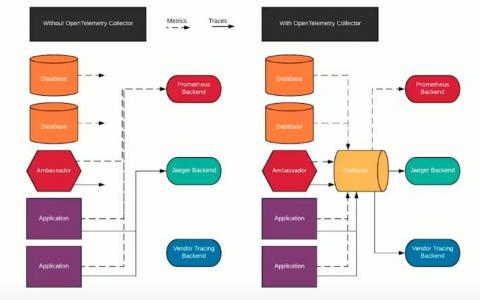
OpenTelemetry has evolved so much since the 2019 KubeCon North America in San Diego, where I live-demoed OpenTelemetry on the keynote stage and highlighted our alpha to the world. We’re excited to be entering general availability of our Collector and Tracing SDKs soon. While I missed the energy from the packed crowd of over 10,000 technologists cheering me on, it was wonderful that this year’s event was more accessible than ever to a worldwide audience.

Announcing Honeycomb support for event ingestion with OTLP

Today, AWS announced enhancements for AWS Distro for OpenTelemetry. We’re working with AWS to build in additional support from partners. In tandem with that launch, Honeycomb is announcing support for event ingestion using OpenTelemetry Protocol (OTLP). With that change, you can simplify management overhead and configuration by no longer needing to maintain a separate OpenTelemetry exporter.

Instrumenting Node.js for Tracing in Jaeger

There is more to Distributed Tracing with Jaeger than just capturing machine data as with metrics, or tailing log files. To start, you should read this primer. In this article, I will walk you through the initial principles you’ll need before executing anything within your codebase. This is going to focus on Node.js, as slight differences and concerns exist for browser applications.

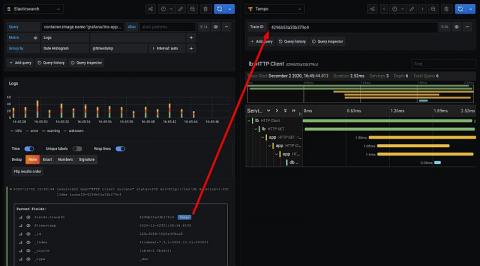
How to find traces in Tempo with Elasticsearch and Grafana

Grafana Tempo, the recently announced distributed tracing backend, relies on integrations with other data sources for trace discovery. Tempo’s job is to store massive amounts of traces, place them in object storage, and retrieve them by ID. Logs and other data sources allow users to quickly and more powerfully jump directly to traces than ever before. Previously we investigated discovering traces with Loki and exemplars.