Mailchimp
Not subscribed to OpsMatters Newsletter


Oracle database availability and performance is key. Gain insight into what happens within your Oracle environment. Using the NiCE Oracle Management Pack for Microsoft SCOM, advanced monitoring has never been easier. The NiCE Oracle Management Pack smart algorithm determines problems and their severity way upfront. Leverage your existing investment, reduce costs, save time and build efficiencies that will last beyond your expectations.
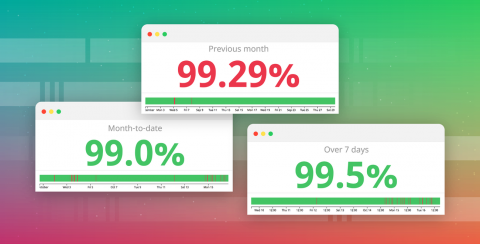
Service level objectives are an important tool for maintaining application performance, ensuring a consistent customer experience, and setting expectations about service performance for both internal and external users. We are very pleased to announce the availability of a new monitor uptime and SLO widget that makes it simple to monitor the status of your SLOs and communicate that status to your teams, executives, or external customers.
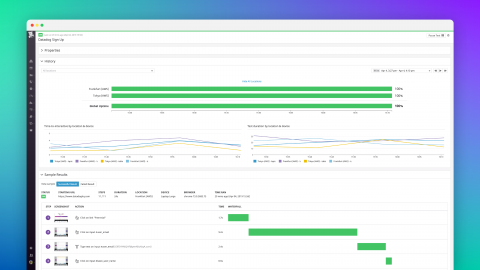
Datadog’s new automated browser tests enable you to automate your user experience monitoring and ensure that your users can complete actions like signing up for a new account or adding items to a cart. Anyone on your team can record and automate multistep browser tests in minutes. Once you create a test, Datadog uses machine learning to detect changes to your application and automatically update your tests accordingly.
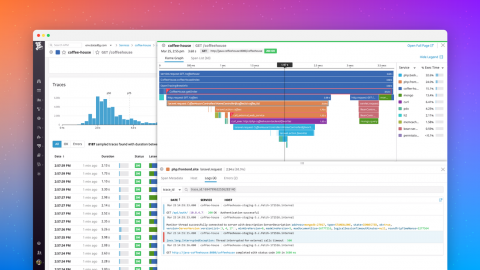
When your users are encountering errors or high latency in your application, drilling down to view the logs from a problematic request can reveal exactly what went wrong. By pulling together all the logs pertaining to a given request, you can see in rich detail how it was handled from beginning to end so you can quickly diagnose the issue.
Even in an era where container, serverless, and cloud-computing technologies garner considerable attention, many companies continue to run a sizeable share of their mission-critical applications on highly resilient, fault-tolerant systems such as IBM AIX on Power-series hardware. AIX, one of the most popular Unix-based operating systems, is trusted by large companies that process critical data such as medical health records and banking transactions.
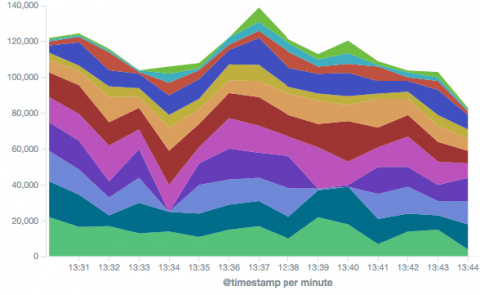
The ELK Stack is a great open-source stack for log aggregation and analytics. It stands for Elasticsearch (a NoSQL database and search server), Logstash (a log shipping and parsing service), and Kibana (a web interface that connects users with the Elasticsearch database and enables visualization and search options for system operation users). With a large open-source community, ELK has become quite popular, and it is a pleasure to work with.