Operations | Monitoring | ITSM | DevOps | Cloud

The latest News and Information on Containers, Kubernetes, Docker and related technologies.

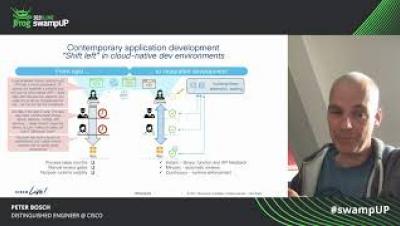
Understanding and tracking the impact of your ever-changing k8s deployments

As developers we’re not always fully aware of security implications stipulated from changes to our code whether these are done in the CI, CD or an artifact database. It is always challenging to predict the impact of a changed 3rd party library, a security context or an RBAC permission, accessing a different network to the same resource or even using an API in a different way than we used to. Understanding the impact immediately and being able to make a change without disrupting the pipeline is therefore an important requirement. This session will present best practices to cope with these day to day changes and will propose a set of tools to address them cohesively.

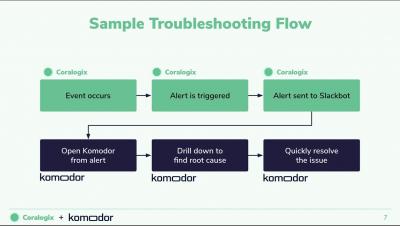
[Webinar] Troubleshooting in Fast Paced Environments with Komodor & Coralogix

On June 2nd, 2021, we participated in a live panel discussion with our friends from Coralogix, featuring our CTO & co-founder, Itiel Shwartz, and Coralogix’s Head of DevSecOps, Oded David. Widespread adoption of agile methodologies, CI/CD pipelines, distributed architectures, and more have enabled software development to reach a rate and scale that would have seemed unimaginable just a few years ago. Of course, along with the benefits of new methodologies and technologies comes a new set of troubleshooting challenges that need to be addressed as well.

Introduction to SMI (Service Mesh Interface) - Kai Hoffman

This time around the topic for the Civo Community Meetup was Kubernetes service meshes and the role they play in providing visibility and open communication between your pods/containers. Kai Hoffman, Developer Advocate at Civo, outlined the Service Mesh Interface, a project to standardise service mesh specifications on Kubernetes.

Monitoring Availability Metrics with Blackbox exporter and Sysdig

The Prometheus Blackbox exporter allows endpoints exploration over several protocols, such as HTTP(S), DNS, TCP, and ICMP. This exporter generates multiple metrics on your configured targets, like general endpoint status, response time, redirect information, or certificate expiration dates. The Blackbox Exporter works out-of-the-box, as it just focuses on external visibility details. To get more detailed metrics, you can instrument your applications.

Performance Tool k6 Acquired by Grafana Labs

There was a big announcement this year at GrafanaCon 2021 that performance testing tool k6 is being aquired by Grafana Labs. It was really exciting news for folks who cheer for open source because these are two giant projects. At time of this writing, k6 has over 12K stars and Grafana with a respectable 42K stars on Github as well. In full transparency, I have used both of those repos many times over the years and am a fellow stargazer.

Rancher Desktop v0.3.0 Release

We are happy to share the v0.3.0 release of Rancher Desktop. This release brings more stability, some new features, and a fresh look to the UI. This screenshot shows the preferences screen while in dark mode on Mac. In the lower left corner the status when performing an action is now displayed. This status will tell you when Rancher Desktop needs to download something, such as a version of Kubernetes you have now used before, or when another step is happening.