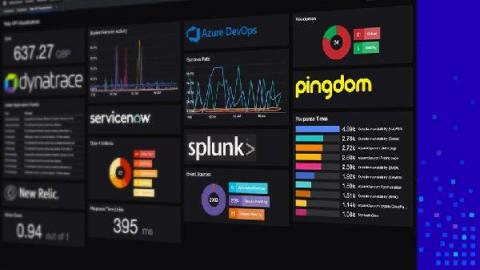
Why choose the Connect license for SquaredUp SCOM dashboards?

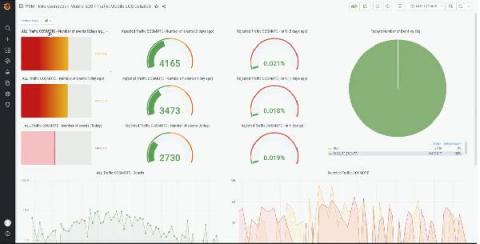
Every enterprise has its arsenal of tech tools to tackle an array of different challenges. If you’re using SquaredUp for SCOM, you already have the best dashboard for SCOM data – but what if you could track all the metrics from all your tools on a single dashboard? Typically, to get the full picture of your infrastructure, you need the right toolset to connect to Web API, a SQL database, or through other means.

Turn your home office into a NOC room with Philips Hue and Grafana

I recently got a couple of Philips Hue Play lights to spice up my home office setup, and after a bit of tinkering with the APIs, I decided it would be a fun project to create my own personal NOC room, using them to visualize the status of some system I’m monitoring.

The future of Prometheus remote write

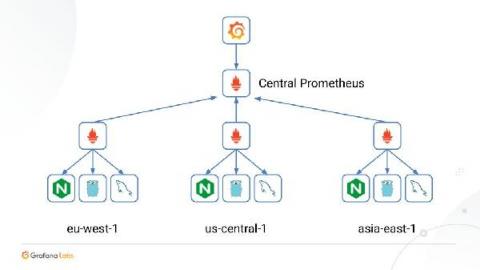
At PromCon last month, Tom Wilkie, Grafana Labs VP of Product, described the origin and purpose of Prometheus remote write and previewed exciting developments on the road map. “We covered our efforts to standardize remote write, document how it works and why it works that way, and then test implementations,” Wilkie said. “In the next release or two of Prometheus, we’ll improve how we send metadata via remote write and start sending exemplars.

Is SquaredUp Dashboard Server an easy alternative to Grafana?

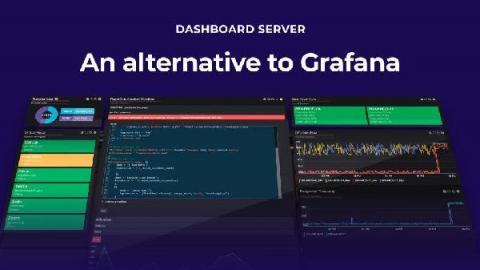
Grafana is free and powerful - a mainstay in DevOps and IT dashboarding. It’s an open-source visualization platform that lets you visualize data in real-time from almost any database. SquaredUp Dashboard Server is, at first glance, quite similar! You can dashboard just about any data to get real-time visualizations. All for free. So… The answer is… Yes, if you want enterprise scale dashboards hosted on Windows Server that are super-fast to set up (and usable by anyone).

How one mobile company is using Grafana Enterprise for billing system observability and beyond

Calling or texting with a mobile phone may seem like a simple process, but behind the scenes, network providers are engaged in a constant exchange of transactions to pay each other for connecting their customers. If telecom companies don’t stay on top of the data and billing, they could be surprised with their own big bills at the end of each month. Cosmote, the largest mobile network in Greece, handles the challenge by using Grafana Enterprise.

Is SquaredUp Dashboard Server the effortless alternative to Grafana?

Grafana is free and powerful - a mainstay in DevOps and IT dashboarding. It’s an open-source visualization platform that lets you visualize data in real-time from a variety of data sources. SquaredUp Dashboard Server is, at first glance, quite similar! You can dashboard just about any data to get real-time visualizations. All for free.

Visualize HAProxy Metrics with InfluxDB

HAProxy generates over a hundred metrics to give you a nearly real-time view of the state of your load balancers and the services they proxy, but to get the most from this data, you need a way to visualize it. InfluxData’s InfluxDB suite of applications takes the many discrete data points that make up HAProxy metrics and turns them into time-series data, which is then collected and graphed, giving you insight into the workings of your systems and services.

Kristina Robinson | Understand and Visualize Your Data with InfluxDB Cloud | InfluxDays EMEA 2021

Learn how you as a developer can use our InfluxDB Cloud web interface to ingest, explore, analyze, and understand your data. We highlight new capabilities and show you some tips and tricks to get the most out of the InfluxDB Cloud Platform.