The latest News and Information on DevOps, CI/CD, Automation and related technologies.
This post is going to be a tad different and longer than what you are used to but I promise, it’s going to be an interesting one. We are going to build a serverless React + GraphQL Web app with Aws amplify and AppSync.
With AWS Lambda, we get scalability and resilience out-of-the-box. What’s more, AWS also provides built-in monitoring, logging and tracing support through CloudWatch and X-Ray. These built-in tools provide a good starting point but many developers eventually outgrow them as their serverless application becomes more complex. In this post, let’s take a serverless application and see how Dashbird can help you debug a serverless application.
Even in this field of work, not everything can be perfected 100%. There are always some situations and cases that will force you to go back or even remain in the present spot, despite your wish to keep going forward at your own pace. In this article, we’ll talk about the cold start impact on latency. What is it? How to fight against it? Is there a successful way of avoiding it or not?
The high-level steps for implementing chaos experiments involve: defining your application’s steady state, hypothesizing the steady state in both the control and experimental groups, injecting realistic failures, observing the results, and making changes to your code base/infrastructure as necessary based off of the results.
With continuous integration becoming standard practice, getting full visibility into your CI pipelines has become a key part of monitoring and troubleshooting. Datadog gives you that visibility with out-of-the-box support for several continuous integration tools, including: GitLab, Jenkins, Travis CI, CircleCI and TeamCity. Monitoring your CI servers can help you identify bottlenecks in your pipelines.
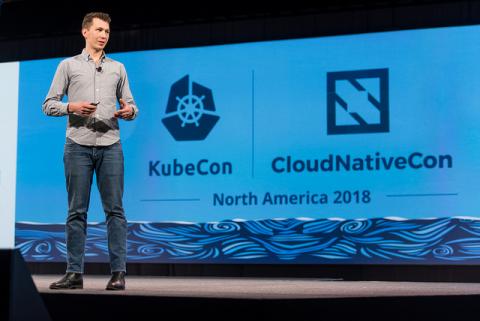
I am embracing managed Kubernetes services and here’s my journey. While I attended KubeCon 2018 ready to soak up all I could about Kubernetes and the cloud-native ecosystem, I sought to learn as much as I could to aid me in running my clusters day to day. More importantly, though, I experienced a fundamental shift in what I see as the future of Kubernetes, and what getting started in Kubernetes looks like for companies today.
I made the trip up to Seattle for KubeCon North America at the end of 2018 along with a bunch of us from Sumo Logic. KubeCon is a conference that specializes in all things Kubernetes and focuses on updating the world on the state of the Kubernetes ecosystem. This year’s event was massive with 8,000 attendees, and talks given by representatives from Amazon Web Services (AWS), Google Cloud Platform (GCP), and Microsoft Azure to name a few big wigs that were there.
In many product development workflows, there are three main concerns: building, testing, and deployment. In this scenario, every change that is made to the code means something could accidentally go wrong, so to lessen the likelihood of this happening, developers assume many strategies to reduce incidents and bugs. One strategy is to adopt continuous integration tools (CI): used together with a source version software to verify if something has gone wrong for every update.
In this post, I’m going to cover some of the fundamentals of how Calico works. I really don’t like the idea that with these Kubernetes deployments, you simply grab a yaml file and deploy it, sometimes with little to no explanation of what’s actually happening. Hopefully, this post will servce to better understand what’s going on.