Did you know that nearly 80% of employees across industries spend thirty minutes daily trying to retrieve information about their assets? Whether you're a small business owner, a financial expert, or an industry tycoon, keeping track of your assets is super crucial for the success of any organization in today's fast-paced business world. This is where the need for the best IT asset management software comes into the picture.
As more organizations embrace the advantages offered by AIOps platforms to more effectively and efficiently monitor and manage their technology estates, ScienceLogic wanted to get an objective sense of the reasons and results behind their decisions. We get a lot of feedback from our customers, and it plays an important role in how we work with individual organizations, but it's hard for a vendor to get reliable information. So we reached out to venerable technology research firm Forrester and commissioned them to survey AIOps users to learn things like why they decided to adopt AIOps, how far along the path to maturity they are, and what features and capabilities they are taking most advantage of.
Change is the only constant in software, and few languages change like JavaScript. In just the last few years, we've had the rise of TypeScript and React, dozens of new frameworks, and Node.js has brought us over to the server-side. Google's V8, which powers Node.js, is one of the fastest JavaScript engines in existence. In simple benchmarks, well-optimized JS executed by V8 often performs almost at the same speeds as famously fast languages like C++. And yet, Node applications often seem to be pretty sluggish. This post aims to guide you through the process of measuring and improving Node.js performance.
When businesses look at how best to understand the performance levels of their platforms, some of the best incident management metrics to look at are Mean Time Between Failures (MTBF) and Mean Time ToResolution(MTTR). These two measurements will give an excellent indication of the health and speed of the system, as well as the ability of the platform to take care of any anomalies that have been detected or to flag them up for others to take action to resolve them.
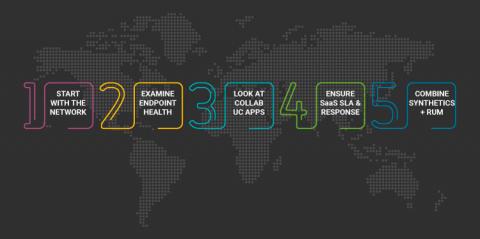
The pandemic sparked a dramatic uptick in corporate use of collaboration and cloud solutions. A related perpetual challenge is that enterprises do only a mediocre job of providing remote users, especially those working at home, with robust Digital Workplace experiences. As part of improving the enterprise Digital Workplace, Enterprises' must begin to conduct thorough digital inventories, focus on network observability, and enforce strong SLA's with cloud providers to address the shortcomings.
What is the difference between logs and events in observability? These two telemetry data types are used for different purposes when it comes to exploring your applications and how your users interact with them. Simply put, logs can be used for troubleshooting and root cause analysis, while events can be used to gain deeper application insights via product analytics. Let's review some application telemetry data definitions for context, then dive into the key differences between logs and events and their use cases. Knowing more about these telemetry data types can help you more effectively use them in your observability strategy.