The entire team at Grafana Labs is thrilled to bring the community our latest and greatest release, Grafana 9, which we introduced at GrafanaCONline this year. In addition to introducing the Grafana Loki query builder, a new command palette, and making role-based access control GA, we also rolled out major updates to the navigation and search functionality in Grafana with the aim of continuing to support the community and users throughout their observability journey.
In 2019, Polar Signals Founder and CEO Frederic Branczyk predicted that continuous profiling would be the future of observability. Today, he’s making that future a reality with his open source continuous profiling tool, Parca. In this episode of “Grafana’s Big Tent” podcast, our hosts Matt Toback and Tom Wilkie chatted with Frederic about how he got his start in the continuous profiling world and how he’s built an active open source community around Parca.
I recently changed teams within Grafana and now I get the chance to work with Grafana Loki, our highly effective open source log aggregation system that stores and queries logs from your infrastructure or applications. At Grafana, we always dogfood our products so what better way to learn more about Loki than trying out a simple use case that I can actually benefit from.
Edgardo Peregrino is a freelance software developer, writer, maker and IT technician. For six years now, I’ve been a passionate maker with a focus on robotics. Recently, I entered the world of cloud native computing, which has allowed me to integrate maker projects with open source tools such as Grafana, Prometheus, and Jaeger.
Grafana 9 launched at GrafanaCONline 2022 in June, and one of the biggest highlights was the introduction of the new Grafana Loki and Prometheus query builders. 🎉 We believe that both of them are going to be incredibly useful for our Prometheus and Grafana Loki users. In this blog post, we will focus on the Grafana Loki query builder and share its new features and improvements with you.
Sometimes the simplest questions prompt the most spirited discussion. Questions like: What is the airspeed velocity of an unladen swallow? What should we have for dinner tonight? Or, as we find out in this episode of “Grafana’s Big Tent" what even is observability?
Behind every feature in Grafana, no matter how big or small, lies a lot of hard work, commitment, and attention to detail. At Grafana Labs, we use a cross-functional team approach to come up with ideas and solutions that ultimately make our products more usable, resilient, and adaptable to user needs. To achieve this, we work collaboratively across the UX, product, and engineering disciplines.
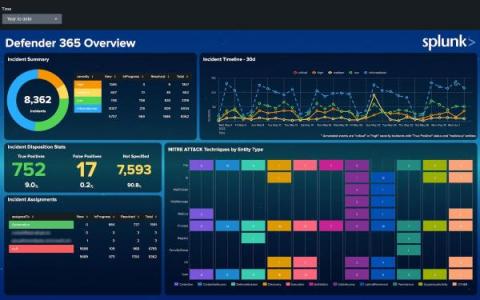
Dashboards are a powerful tool for communicating a lot of information at once. Many Splunk apps are packaged with dashboards to help you make the most of your data. For example, the Microsoft 365 App for Splunk comes with a number of dashboards to provide insights around usage, incidents, and more.