Operations | Monitoring | ITSM | DevOps | Cloud

The latest News and Information on DevOps, CI/CD, Automation and related technologies.

Day 0, Day 1, Day 2 Operations: Putting it All Together on Day 2

Following good practices in the Day 0, Day 1, and Day 2 software development lifecycle can help you create a consistent environment that is easier to maintain. In this blog, we will deepen your understanding of how to make Day 2 operations succeed, and how high performing teams put Puppet to work on Day 2 to make a stronger, less manual, software development lifecycle.
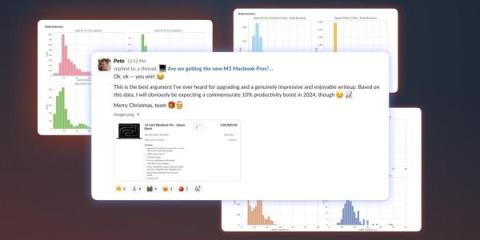
Tracking developer build times to decide if the M3 MacBook is worth upgrading

All incident.io developers are given a MacBook which they use for their development work. That meant when Apple released the M3 MacBook Pros in October, people naturally started asking questions like “wow, how much more productive might I be if my laptop looked that good?” and “perhaps we’d be more secure if our machines were Space Black 🤔” Pete’s (our CTO) response to this was “if you can prove it’s worthwhile, we’ll do it”

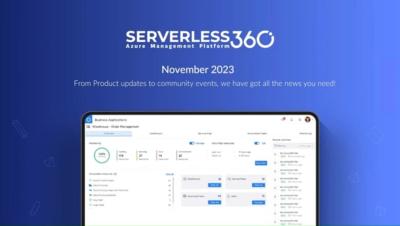
What's New in Serverless360: Scaling VMs up/down, Azure Automation runbooks management & monitoring.

Serverless360's latest update, version 3.2.0, brings a suite of enhancements. These include Azure Automation runbooks management and monitoring, Scaling VMs up/down between different service tiers in schedules, Synapse pipelines in optimization schedules, and much more.

Monitor GitHub Using Telegraf and MetricFire

Monitoring your GitHub account is important for maintaining code quality, facilitating collaboration, ensuring security, enabling smooth development workflows, and improving overall project management and efficiency. This will allow you to stay updated on code changes, pull requests, issues, and comments and facilitates collaboration among team members, ensuring everyone is informed about the progress and status of your projects.

Monitor MongoDB With Telegraf

Monitoring your instance of MongoDB is important for maintaining optimal database performance, ensuring security, detecting and addressing issues promptly, and planning for future growth and scalability. Database and infrastructure monitoring allows for the early detection of potential problems such as server overload, disk space shortages, or network issues.

All I want for Christmas... from Slack

When declaring and responding to an incident with incident.io, most of your interactions with our product will go via Slack. You might configure your forms in our web dashboard, but the responder using them to declare an incident is most likely doing so from a Slack modal, and the incident announcement will be posted as a Slack message. This means a lot of our product design falls within the constraints of what we can build using Slack’s block kit.

Kubernetes Reliability Risks: How to monitor for critical issues at scale

Learn how to automatically find and fix the most critical Kubernetes reliability risks in enterprise organizations. Recent research shows that nearly every organization has reliability risks in their Kubernetes clusters. Many of them are caused by simple misconfiguration, but they can have devastating consequences—including taking critical services offline. And while you could manually review every Kubernetes deployment, the speed and scale at which most organizations deploy to Kubernetes makes that impractical.

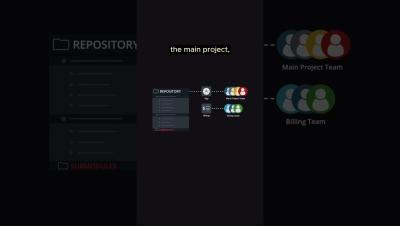
What are #submodules in Git? | #shortsvideo

Submodules let you include external repositories within your own main projects. They're a game-changer for managing dependencies, ensuring clean code organization, and collaborating effectively! 💡 With submodules, you can easily integrate external libraries or components into your project while maintaining precise control over versions and updates. 🛠️