Operations | Monitoring | ITSM | DevOps | Cloud

The latest News and Information on Log Management, Log Analytics and related technologies.
Cribl On Your Coffee Break Episode 13 - Routes, part 2: Many-to-one

Leon is back from the BlackHat conference and it shows (or at least it SOUNDS like it). Despite a little bit of laryngitis, today he’s continuing the exploration of routing by focusing on taking multiple sources of data and using routes to send them to a particular destination. By the time the month is over, you will have a pretty good idea of what Cribl can do, and how to do it. You’ll also have consumed more caffeinated beverages than is strictly appropriate...

September 2026 at Bindplane: Bindplane Agent and a new Overview page

Also this month, a new BDOT 1.107.0 release, and you can start a configuration from a Full-Pipeline Blueprint. Here’s what happened in the last month. Prefer to watch? The September Community Call is streamed live on YouTube. Watch " YouTube" on YouTube Watch.

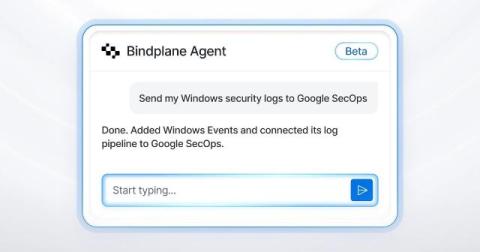
Bindplane Agent Is Here: Build, Edit, and Understand Pipelines in Plain Language

Pipeline Intelligence already recommends processors, reads live telemetry, detects log types, and generates processor bundles from natural language. But most of it lives inside a single processor node. You still have to know which one to open and what to ask for. This changes today. Bindplane Agent is your AI assistant inside Bindplane, ready to act on what you describe in plain language.

How backend functions extend Cribl Apps: Scheduling, local testing, and logs

See how backend functions extend Cribl Apps with live data retrieval, scheduled jobs, local testing, deployment validation, and logging. In this walkthrough, Giovanni Mola shows developers how to connect app data sources such as Jira and news feeds, manage schedules, preview functions locally, verify a live deployment, and inspect emitted logs in Cribl Search.

Kubernetes dashboards for container logs and cluster events

The Dashboard Library on Logit.io Logs stacks has two Kubernetes packs: Kubernetes container logs (six dashboards for pod stdout and stderr shipped by Filebeat) and Kubernetes cluster events (six dashboards for the Event objects the API server records, such as BackOff, Unhealthy and FailedScheduling). The container logs pack fills as soon as your Filebeat DaemonSet adds Kubernetes metadata, but the cluster events pack needs an event exporter, because events never appear in container log files.

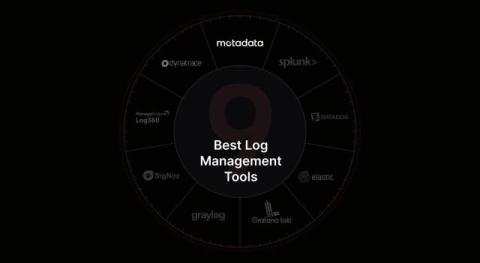
9 Best Log Management Tools and What They Cost

Most log management tools bill you on log ingestion, the volume of data you send them. That works until your log volume doubles, and the invoice doubles with it. The best log management tools let you control what gets indexed and kept, so growth stops being a budget problem. In this blog, you will see: By the end you will know which fits your volume. Log management is the full lifecycle of your log data, from the moment it is collected to the moment it is deleted.

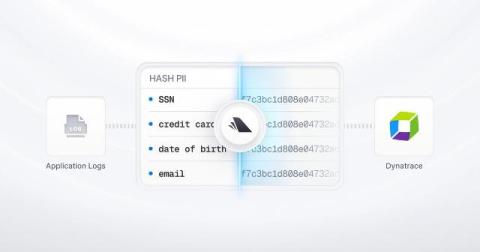
Redact PII at the edge - and still be able to search for it

Ask a platform team why their application logs aren't in their observability backend and you'll often get a one-sentence answer: And, that's where the conversation ends. The logs stay in a silo. Or, they don't get collected at all. The team loses the troubleshooting signal, and nobody revisits the decision because the alternative looks like a compliance violation. Application logs in healthcare, aviation, insurance, and retail are full of personal information that should not be stored in plain text.

Log ingestion: you are probably paying to store logs you will never read

The default way to adopt log management is to ship everything and search it later. It is the path every vendor’s quickstart puts you on, and it is the reason log bills surprise people: ingestion is priced by volume, so“ship everything” is a spending decision disguised as a configuration default. The uncomfortable part is that most of that volume is never read. Nobody greps last Tuesday’s 200 OK access lines.