The latest News and Information on Monitoring for Websites, Applications, APIs, Infrastructure, and other technologies.
Navigating the realm of Windows observability often referred to as O11y (short for observability), can be a complicated journey. Windows environments are known for their complexity, with various services, applications, and workloads running on each host.
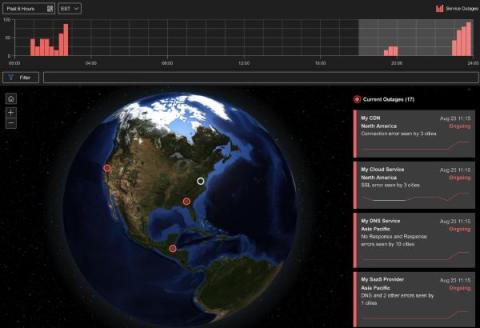
When outages cost you tens of thousands of dollars each minute, pinpointing the source of disruptions as quickly as possible becomes mission-critical. This is not a time for finger-pointing and hastily assembled war rooms searching for that needle in the haystack. You need simple, intelligent, trustworthy Internet health information to expedite your incident detection.
In recent months, we’ve talked a lot about how AppNeta by Broadcom offers active monitoring capabilities, and how they enable teams to rapidly troubleshoot issues across both internally managed networks and those managed by third parties, such as ISPs and cloud providers.
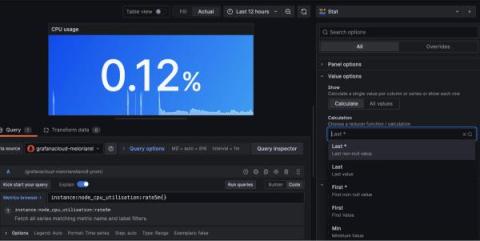
Grafana is an open source visualization and monitoring solution for correlating and analyzing data from various sources. From time series graphs to heatmaps to 3D charts, it gives you lots of ways to untangle complex datasets. And while that’s incredibly powerful for observability, sometimes you’re looking for something fairly straightforward.