The latest News and Information on Monitoring for Websites, Applications, APIs, Infrastructure, and other technologies.
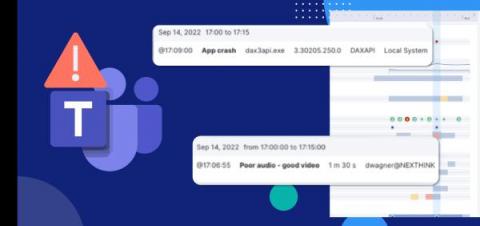
When was the last time you had to ask someone to repeat something during an MS Teams call, or had to restart the app, just because the call quality dropped? Sounds familiar? Frustrating, isn’t it? Now imagine hundreds, if not thousands, of employees feeling this frustration at work. Think of the time lost for them, for the organization, and—more importantly—for those who’ll need to fix it. As EUC professionals, we cannot let that happen.
The demand for continuous innovation and faster delivery requires a fresh approach to monitoring modern apps and APIs. As development environments grow increasingly dynamic and complex, monitoring performance through a platform that is fully programmable, handles app and API-testing, is optimized for developers, and integrates with existing tools and workflows becomes increasingly critical.
Every article you find about reducing Azure cost will invariably mention ensuring any unused (especially PAYG) resources are identified and shut down/deleted. However very few actually will tell you “HOW” to do this. eG Enterprise has added new functionality to enable you to identify unused, wasted and orphaned Azure resources and services without the need to resort to hacking up KQL queries or PowerShell scripts.
The Grafana Agent team is excited to announce Grafana Agent Flow, our newest experimental feature in today’s Grafana Agent v0.28.0 release. Flow is an easier and more powerful way to configure, run, and debug the Grafana Agent! 🎉
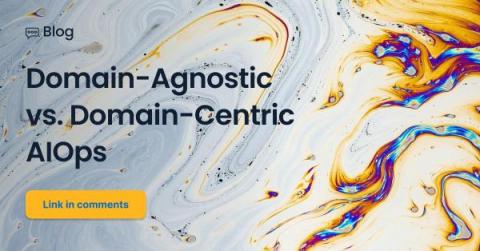
No matter what we do, we’ll always be surrounded by choices. Do I save money and take the bus, or do I spend money filling up my gas tank? Do I make dinner at home, or do I eat dinner out? Whatever the outcome, it’s our needs – what we require and what we can afford – that help guide us to where we should go. Technology is no exception. Especially in AIOps.
Welcome to the September edition of What’s New in Sysdig in 2022! I’m Ayu Shah, Principal Sales Engineer based out of San Francisco Bay Area. I joined Sysdig a little over six months ago and it has been an exciting journey to say the least! I have worn many hats in my career, from Software Engineering to Sales and everything in between. I am excited to share some updates to What’s New in Sysdig for this month!
So far in our series on scaling observability for game launches, we’ve discussed ways to 1) quickly analyze large volumes of telemetry data and, 2) ensure high-quality telemetry data for more effective analysis at lower costs. The best practices in these blogs outline best practices for scaling observability during game launch day – which is necessary to ensure high performance across all infrastructure components – to ensure no lag, no glitches, and no bugs.
Network monitoring is ideal for getting a real-time view of your connected environment, and with reports, you can look back in time too. Logs are key to this rear-view mirror look, as they contain all the data for all the elements you are monitoring. But without network log archiving, you can only look back so far. Did you know that according to an IBM/Ponemon study, it takes an average of 287 days to discover and contain a data breach?