Monitoring Physical Security With Graylog final
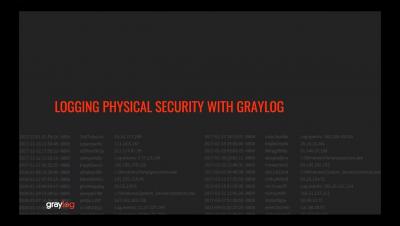
Jeff Darrington is back once again, this time with a video all about where physical security meet cyber security and how Graylog can help you monitor both.


The latest News and Information on Monitoring for Websites, Applications, APIs, Infrastructure, and other technologies.
Mission creep is a phenomenon that occurs after a project begins and gains momentum, but then gradually grows beyond the original, intended scope. One day you wake up and realize that, instead of an efficient, manageable project, you’ve got a monster on your hands. For enterprises in the midst of dynamic growth, IT infrastructure is often beset by mission creep. The incumbent organization acquires smaller operations, integrates their technology, and soon things are out of control.
Debugging is the process of identifying, analyzing and removing errors in the software. It is a process that can start at any stage of the software development, even as early as the software has been written. Sometimes, remote debugging is necessary. In the simplest terms, remote debugging is debugging an application running in a remote environment like production and staging.
Alerts are notifications from AIOps monitoring tools that indicate that there is an anomaly. IT teams get these alerts on their monitoring dashboard via emails or enterprise collaboration tools such as Slack or Teams. Service level agreements expect IT teams to analyze every alert within a specific timeframe and take appropriate action.
Alerts are indispensable to any IT operations system today. Site reliability engineers (SREs) or ITOps executives set up several monitoring tools for their IT landscape. When there is a change, high-risk action, or outage in any of these incidents, the monitoring tool triggers an automated alert. This could happen on the monitoring tool’s dashboard itself, via email, or enterprise collaboration tools like Slack or Teams.
The most effective way to understand an incident, resolve it and prevent it from occurring again is root-cause analysis. Simply put, root-cause analysis is the study performed by ITOps teams or site reliability engineers (SREs) to pinpoint the exact element/error that caused the unexpected behavior. Based on this, they plan remediation. Accurate and timely root-cause analysis can have a direct impact on the company’s top and bottom line.