Operations | Monitoring | ITSM | DevOps | Cloud


The latest News and Information on Monitoring for Websites, Applications, APIs, Infrastructure, and other technologies.


Measuring Success with Sentry
In the early days of web development, there was one way to measure code: WTFs per minute. It was a metric that could be applied across all languages, as every developer knew what WTF meant (Works That Frustrate, obviously). Today, however, code is too intricate — and important — for clever, opaque metrics. You need objective data that communicates the quality and stability of your code — KPIs such as events accepted, transaction outcomes, and crash-free sessions.
2 reasons you need Dashboard Server with SquaredUp Connect or EAM
We’ve seen how much you love SquaredUp. But we’re also aware that opening up access to your SCOM and Azure data can sometimes hold you back from sharing the joy of powerful dashboarding with other teams. And what about trying to get an overview of multiple SCOM management groups without having to log into each one individually? We have the perfect solution for both problems.

Is "Vendor-Owned" Open Source an Oxymoron?
Open source is eating the world. Companies have realized and embraced that, and ever more companies today are built around a successful open source project. But there’s also a disturbing counter-movement: vendors relicensing popular open source projects to restrict usage. Last week it was Grafana Labs which announced relicensing Grafana, Loki and Tempo, its popular open source monitoring tools, from Apache2.0 to the more restrictive GNU AGPLv3 license.

What is Prometheus - Use cases
Prometheus is an open-source tool that’s meant to monitor and collect metrics from applications. The point of this system is to make it easy for users to see and understand important metrics that let them know how well an application is doing. In fact, Prometheus is able to collect over one million metrics per second, and then store them until you’re ready to retrieve them.

What Is Thanos - Use Cases
When you hear the word "Thanos," your first thought might be the Marvel Cinematic Universe villain from the Avengers: Infinity War film who seeks to collect the Infinity Stones and end half of all life in the universe. But if you mention the word to a data nerd, you're likely to get a very different response. Prometheus is a free and open-source platform for real-time systems and event monitoring and alerting.

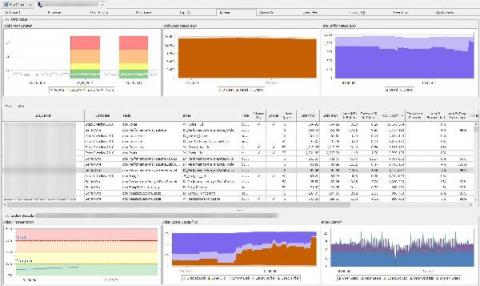
How to Speed Database Troubleshooting
Identifying Index Fragmentation With SQL Sentry

Reliability Monitoring For Improved Digital Experience
Monitoring methodologies evaluate application reachability, availability, performance, and reliability to measure digital experience accurately. Only measuring one or the other will offer a skewed view of the end-user experience. For example, higher availability is not the sole indicator of a good end-user experience. At the same time, reliability is a critical performance indicator for service providers.
Elixir SDK for ConfigCat
One of the great things about SaaS applications is that users in the platform automatically have access to any available software updates. Yet, having a beta program requires a separate environment, creating a potential challenge for users and development teams. In this context, having a tool where you can control features and flag certain users is important because sometimes features are too early or not relevant for all users.