The latest News and Information on Monitoring for Websites, Applications, APIs, Infrastructure, and other technologies.
In our last release of the PowerShell security series, we talked about how PowerShell could be leveraged by malicious actors to gain unprecedented access to your organization’s critical assets. From enumerating sensitive domain information and carrying out credential-based attacks to running malicious executables in memory (file-less malware), we shined a light on the potential of PowerShell and why it’s an ideal weapon for cyber attackers today.
Stefano Mitchell is a customer support engineer at SkySilk Cloud Services. It’s no secret that there is a correlation between a team having quick access to metrics and swift resolutions. Accurate monitoring metrics displayed in a clear and efficient manner help your teams respond to alerts and issues as they arise in real time. SkySilk Cloud Services, a cloud services provider, uses Grafana dashboards internally to maintain a strong overview of regional system health.
Here at Sentry, we use Travis CI, a continuous integration tool for GitHub that lets us automate our tests and view the results right within each pull request. In this blog post, we’ll walk through a quick example of how to automatically create Sentry Releases with Travis CI when a commit is pushed to your project’s master branch. (Sentry Releases enable some of our best features, like identifying the commits that likely introduced new errors, and much more!)
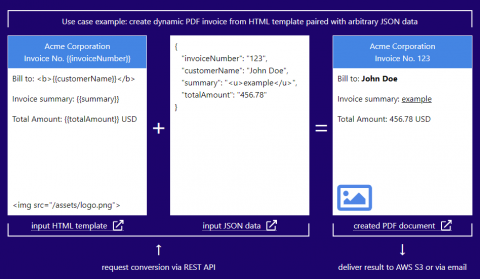
We are releasing our HTML to PDF REST API to public preview: https://html2pdf.appbeat.io/ We are using this tool internally for generation of various PDF documents. It uses Chrome engine for HTML rendering and creates really nice looking documents. It supports synchronous and asynchronous operation where you can be notified about PDF conversion result via webhook.
When an outage hits your service, everybody starts talking. Your engineers are talking about what caused the problem, and how to fix it; your management is asking about when it’ll be fixed; and your customers are telling the world that they’re not happy. But there’s an even more important conversation you should be having: communicating with your users about the issue.
To have Observability is to have the ability to understand your system’s internal state based on signals and externally-visible output. Honeycomb’s approach to Observability is to strive toward this: every feature of the product attempts to move closer to a unified vision of figuring out what your system did, and how it got there.
In this article we will look at the agent-like instrumentation tool T-Trace. The tool provides non-intrusive instrumentation capabilities for applications running on GraalVM. We will instrument a simple NodeJS application by using T-Trace and OpenTracing API with Jaeger NodeJS tracer.
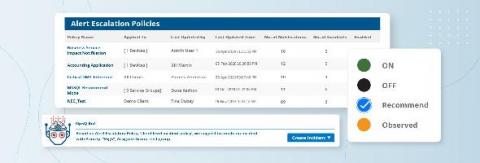
Learn about OpsQ Recommend Mode, a new feature delivering auto-suggestions for alert escalation policies with OpsRamp’s machine learning algorithms. Recommend Mode builds upon Observed Mode by enabling one-click automation of suggested actions for alert escalation management. You can follow two approaches to use OpsQ Recommend Mode: First-Response and Alert Escalation.