Operations | Monitoring | ITSM | DevOps | Cloud

The latest News and Information on Monitoring for Websites, Applications, APIs, Infrastructure, and other technologies.

Episode 19- What Gen Z Actually Thinks About AI

In Part 1 of this conversation, three early-career professionals at Digitate — Ryan Bascos, Renad Morrar, and Ritu Bhalodia — join The Intelligent Enterprise to share what it actually feels like to start a career in the age of AI: the tools they rely on, the concerns they carry, and what their generation sees that others might be missing.
The Jolokia Problem: Eight CVEs, One Door in Apache ActiveMQ

The Apache ActiveMQ Jolokia endpoint has been the route to remote code execution in three separate years. In 2023, it was reflection into the JVM. In 2024, a default configuration left it without a login. In 2026, it was the broker's own management operations, patched in March, exploited in April, and reopened three more times by summer.

IBM MQ Alternatives: When ActiveMQ and Artemis Make Sense

What IBM MQ costs an organisation is a knowable figure. It comes off a renewal statement, an entitlement count or a licensing review, and finance can put a number against it down to the core. What replacing it would save is not knowable in the same way. There is no independent case study in the public record carrying real durations, team sizes and application counts, and every migration timeline in circulation comes from an organisation selling the migration.

Instrumentation Hub in Grafana Cloud: start easier, stay in control

It's no secret that getting started with observability can be much harder than it should be. That's why, at ObservabilityCon 2025, we introduced Instrumentation Hub: a guided, scalable way to roll out observability coverage while still keeping you in control. Today, we’re excited to announce that Instrumentation Hub is now Generally Available in Grafana Cloud.

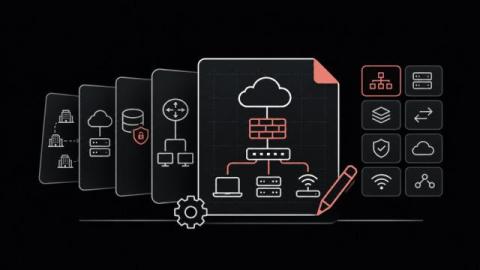
Network Diagram Examples: 8 Types and How to Draw Them

Most network diagrams we come across land in one of two piles: the one drawn for an audit years ago and never opened since, and the one so crowded that finding the firewall takes squinting. The network diagram examples below sit between those piles, 8 diagrams IT teams actually use, sorted into physical, logical, and cloud or WAN. For the full build process behind one map, see our guide to the network topology diagram.

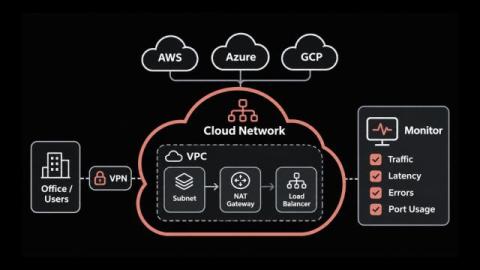
What Is Cloud Networking? Types, Benefits and How to Monitor It

Think about Outlook, Salesforce or the shared drive your staff open each morning, and at least one of them probably runs in AWS, Azure or Google Cloud. That puts a good share of your traffic on a cloud network nobody on your team has ever seen. You still own a lot of that path (the VPN link, the route tables, the security groups), and it breaks in ways an office network doesn't.

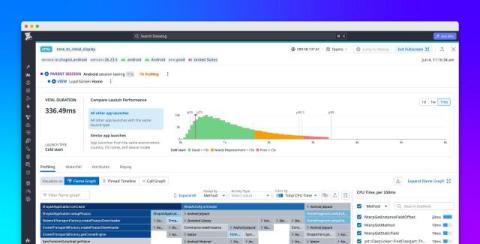
Diagnose frontend performance issues with RUM Profiling

When a mobile application takes too long to launch or becomes unresponsive, it can be difficult to find the cause. Datadog Real User Monitoring (RUM) helps developers detect these issues and understand which users are affected. But knowing that an application is slow doesn’t tell you which part of its code is responsible. Engineers often need to reproduce the problem locally, piecing together performance metrics and code execution information from separate tools.

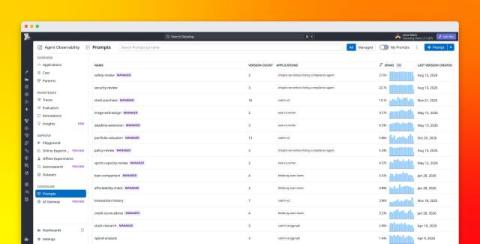
Manage and deploy LLM prompts with Datadog

Prompts are an important part of LLM application behavior, but teams often manage them alongside application code or across separate notebooks and configuration files. This can make prompt changes dependent on application releases and make it difficult to understand which version is running in each environment. When a change affects application quality, latency, or cost, teams also need a way to connect that behavior back to the prompt version that produced it.

Can driver-monitoring systems help prove fault in a rideshare crash?

Driver-monitoring systems are increasingly used by rideshare companies to capture data during every trip. These technologies gather detailed information that can become crucial evidence in resolving rideshare accidents. Understanding how this evidence is collected, preserved, and accessed is important for both passengers and legal professionals in places such as Paramus.

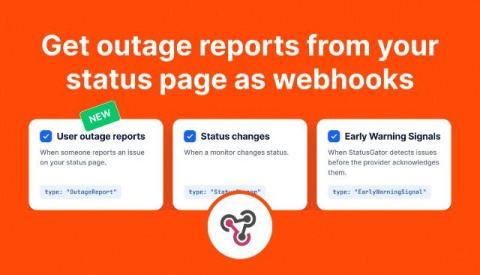
Get outage reports from your status page as webhooks

StatusGator webhooks now support user outage reports, so you can send reports from your status page to your own tools as soon as they’re confirmed. We’ve also added event settings to each webhook, letting you choose which notifications an endpoint receives. Use outage reports to create support tickets, alert your on-call team, or collect reports for analysis. Each payload includes the affected service, selected components, the reporter’s comment, and their approximate location.