

Operations | Monitoring | ITSM | DevOps | Cloud

The latest News and Information on Monitoring for Websites, Applications, APIs, Infrastructure, and other technologies.

Sponsored Post

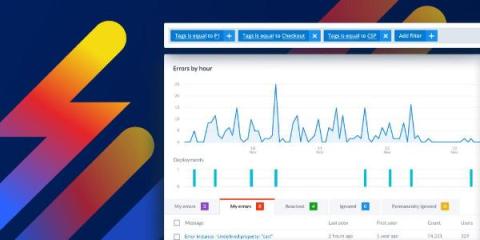
Proactive error management: Collaborate effectively and work smarter with tags

Talking to many of our customers with different needs and use cases, one particular issue comes up all the time. When I'm seeing so many error groups in my app and so many error notifications in my inbox every day, it's easy to end up feeling overwhelmed. I want a more proactive system to alert me to which errors need attention and when, so that I can stop getting buried. Does this hit home? Then this article is written for you, the tech leads and the product managers who are on the front-line of issue prioritization.

Introducing AppSignal for Startups

Good monitoring shouldn't be a luxury for well-funded teams. Early-stage startups run the same production systems as everyone else, on a tighter budget. That's when clear observability earns its keep. Today we're launching AppSignal for Startups: an ongoing discount on the full AppSignal platform for early-stage teams, with a better deal for Y Combinator companies.

Stop Guessing Why Latency Spiked | Lightrun

Latency spikes are easy to detect. Understanding why they happened is the hard part. Gidi Freud explains how Lightrun helps engineers debug latency spikes by automatically capturing runtime context when a execution of code exceeds a defined threshold. Instead of only seeing that a method or code block was slow, you can capture local variables and source location from the exact execution that crossed the threshold.

Tech Talk: Observability Simplified, APM and Network Behavior

Participants are welcomed to a session titled "Observability Simplified," focusing on user experience, application performance, and network behavior. This second part of a three-part series highlights how the Splunk Observability Cloud and Cisco ThousandEyes can create a unified view of applications, infrastructure, and network performance. Key discussions include addressing siloed troubleshooting, enhancing visibility, and a live demo showcasing how to identify network issues affecting application performance. Attendees are encouraged to participate in the Q&A and are reminded that the session will be recorded for future reference.

SLA vs SLO vs SLI Explained: What Should You Track?

In this video, learn the difference between SLA, SLO, and SLI and why understanding each one is essential for delivering reliable IT services. Discover how these three service level metrics work together and why tracking the right one helps improve service reliability, customer satisfaction, and operational performance. Whether you're an IT operations professional, SRE, DevOps engineer, or service manager, this video explains SLA, SLO, and SLI in simple terms so you can build measurable goals and realistic service commitments.

8 Best Patch Management Software for 2026

Somewhere in your environment, a patch is sitting in a queue because the last rollout broke something, and nobody wants to run it again. That is the exact failure mode good patch management software is supposed to prevent, and multiplied across a few hundred endpoints, it is exactly the kind of gap attackers look for.

ActiveMQ Backup and Disaster Recovery: Complete DR Guide

A message broker's backup and disaster recovery plan is the last line of defense against scenarios that HA cannot address: a full datacenter outage, catastrophic hardware failure that destroys both primary and secondary nodes, accidental message deletion, or KahaDB corruption that prevents the broker from starting.

ActiveMQ JVM Memory & GC Tuning: Heap Sizing, G1GC, ZGC Guide

The JVM is the runtime foundation of every ActiveMQ deployment. Message throughput, delivery latency, producer flow control triggers, OOM crashes, and GC-induced delivery pauses all trace back to JVM memory configuration. Yet ActiveMQ ships with a 512MB heap and no GC logging, appropriate for a developer laptop, not for an enterprise message broker handling millions of messages a day.

From Prototype to Production With AWS AgentCore

"Hello world, this is your agent speaking!" The agent loop! The LLM is calling tools, the answers are sensible, and the sky's the limit. Now, as you look forward to production, you look for a composable toolset, something that can grow with your use case and system needs. That's what we created with Honeycomb Canvas: a collaborative investigation space where AI agents help you understand, fix, and learn about your system.