Operations | Monitoring | ITSM | DevOps | Cloud

The latest News and Information on Observabilty for complex systems and related technologies.

Golang Monitoring using OpenTelemetry

When it comes to monitoring Golang applications, there are various tools and practices you can use to gain insights into your application's performance, resource usage, and potential issues. By using OpenTelemetry for monitoring in your Go applications, you can gain valuable insights into the behavior, performance, and resource utilization of your distributed systems, allowing you to troubleshoot issues, optimize performance, and improve the overall reliability of your software.

How Telemetry Pipelines Save Your Budget

This is an updated version of an earlier blog post to reflect current definitions of a telemetry pipeline and additional capabilities available in Mezmo Our recent blog post about observability pipelines highlighted how they centralize and enable telemetry data actionability. A key benefit of telemetry pipelines is users don't have to compare data sets manually or rely on batch processing to derive insights, which can be done directly while the data is in motion.

Chaos testing a Postgres cluster managed by CloudNativePG

As more organizations move their databases to cloud-native environments, effectively managing and monitoring these systems becomes crucial. According to Coroot’s anonymous usage statistics, 64% of projects use PostgreSQL, making it the most popular RDBMS among our users, compared to 14% using MySQL. This is not surprising since it is also the most widely used open-source database worldwide.

Implementing High-Cardinality Instrumentation in Frontend Apps

As the Product Manager for Honeycomb’s new frontend product, Honeycomb for Frontend Observability, I’ve had the joy this past year of speaking to dozens of frontend engineering teams about observability. Many frontend teams come from worlds where they either rely on QA and customer reports to identify issues in production, or they use real use monitoring (RUM) and error monitoring tools to catch the most egregious issues.

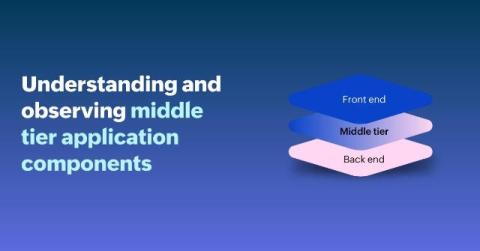
The importance of understanding and observing an application's middle-tier components

Just like how the filling makes a sandwich, an application's performance is closely tied to how effectively its middle-tier components function. While the front-end is what users see and interact with (UI), and the back-end deals with data storage, the middle tier forms the vital core where the real magic happens—processing, logic implementation, and enforcement of business rules.

How to Use Static Thresholds for Effective Alerts in Splunk Observability Cloud

In this video, we explore the concept of static thresholds, which are a foundational tool in your observability alerting solution. You’ll learn: Additionally, we will demonstrate static thresholds in Splunk Observability Cloud. We’ll configure a static threshold for AWS EC2 memory utilization. We’ll also look at additional threshold settings like trigger sensitivity and duration. By the end of this video, you'll have the knowledge to effectively incorporate static thresholds into your observability strategy.

DataDog vs Prometheus [2025 comparison]

DataDog and Prometheus are both popular monitoring solutions used to collect and analyze metrics and monitor the performance of systems, but Prometheus is open source and Datadog is proprietary. Datadog provides a unified platform for monitoring, troubleshooting, and optimizing modern cloud-native applications and infrastructure. Prometheus is the most popular tool for monitoring time series metrics. So, how to choose between Datadog and Prometheus?