Operations | Monitoring | ITSM | DevOps | Cloud

The latest News and Information on Observabilty for complex systems and related technologies.

Kubernetes Monitoring and Alerting Made Easy with Splunk Observability Cloud and OpenTelemetry

In this video, I'll show you how to quickly setup monitoring and alerting for your Kubernetes clusters using Splunk Observability Cloud. We’ll start by deploying the Splunk OpenTelemetry Collector using Helm, and then use the Kubernetes Navigator inside Splunk Observability Cloud to view the health of our cluster and the applications it’s hosting. I’ll demonstrate AutoDetect detectors and alerts by intentionally triggering an issue in the cluster and walk through the alerting process. We’ll review the alerts in Splunk Observability Cloud and then resolve the issue in the cluster.

Keeping Spending in Check: Observability's Positive Impact on Cost Management

Tool sprawl within organizations doesn’t just create a fragmented user experience; it poses a real threat to enterprises’ bottom lines. Consider these statistics: This fragmentation significantly limits worker productivity. IT leaders spend hundreds of hours trying to manage multiple tools, map their environments, and upkeep aging systems that are either outdated or simply no longer necessary.

Kentik - Cloud Observability

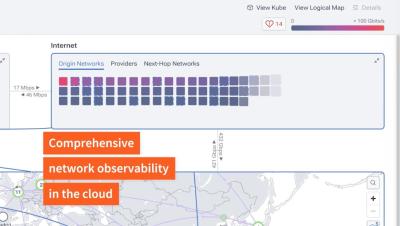
Kentik Cloud provides comprehensive visibility across all major public clouds, offering seamless insight into cloud-to-on-prem network paths and the public internet routes connecting them. Identify latency, loss, jitter, and application-specific traffic while providing deep visibility into cloud networking constructs like ACLs to spot security issues. With powerful analytics, Kentik Cloud enables you to visualize intra-cloud traffic, identify idle resources for optimization, and leverage historical data to uncover trends and seasonal patterns—ensuring optimal cloud performance and cost efficiency.

Streamlining Telemetry with Apica's Fleet Management Solution: A Deep Dive

In the rapidly evolving IT environment, observability at scale has become a critical challenge for organizations aiming to maintain operational excellence. The proliferation of telemetry collection agents across diverse infrastructures often increases complexity, resource strain, and configuration inconsistencies.

Booking.com's Journey to Enhanced Observability

Since its early startup beginnings in Amsterdam, Booking.com has redefined the travel industry, establishing itself as a premier platform for millions of travelers worldwide. With over 28 million accommodation listings and a staggering 1.5 million room nights booked every day, Booking.com operates on a scale that demands a robust and constantly monitored infrastructure.

Monitoring database exposure on Kubernetes and VMs

This week, security researchers at Wiz published a report about an internal database at DeepSeek being exposed to the internet. This kind of security risk is surprisingly common and can affect any company. The only way to prevent it is through continuous monitoring. But in modern infrastructures, services can be exposed in many different ways, making detection tricky. At Coroot, we realized that the telemetry data we already collect can help identify these risks — without requiring any extra setup.

Realizing the business value of OpenTelemetry-native observability

Transform your organization's observability strategy with open standards and simplified data collection Modern organizations face an unprecedented observability challenge. As systems grow more complex and distributed, traditional monitoring approaches are struggling to keep pace. With data volumes doubling every two years and systems spanning multiple clouds and technologies, organizations need a new approach to maintain visibility into their operations.

Catching Up With Fender: How Frontend Observability Powers Better User Experiences

For years, Fender Musical Instruments has been synonymous with iconic guitars and amplifiers. But in recent years, the company has expanded its legacy into the digital realm, offering tools like Fender Play, an innovative learning platform for aspiring musicians. Behind this digital evolution lies a focus on delivering exceptional user experiences for its consumer-facing applications—a mission supported by Honeycomb for Frontend Observability.

Using AI for Troubleshooting: OpenAI vs DeepSeek

AI is now a go-to tool for everything from writing to coding. Modern LLMs are so powerful that, with the right prompt and a few adjustments, they can handle tasks almost effortlessly. At Coroot, we’ve been experimenting with AI for observability. Our goal is to make it useful in the final stage of troubleshooting—when we’ve already identified which service is causing issues, like Postgres, but finding the exact root cause is still tricky due to the many possible scenarios.

The power of cloud native observability

Unstructured data clouding your observability goals? Learn why monitoring alone cannot solve business-critical performance issues as Sr. Director of Technical Marketing Adam White explains how combining structured and unstructured data with real-time analytics unlocks dynamic insights into root cause analysis and performance management in the cloud.