Operations | Monitoring | ITSM | DevOps | Cloud

Why 76% of AI agent pilots stall, and how your Agentic ITOps pilot can avoid the same fate

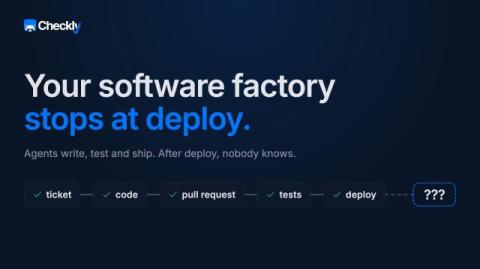
The debate is no longer whether AI belongs in ITOps; it’s about how quickly it can be implemented, how to measure it, and who’s accountable when it acts. And although IT leaders across industries are scrambling to integrate agentic AI into their operations, those deployments are facing serious challenges. A new Harris Poll survey of more than 300 U.S. data and AI decision-makers puts a number on the problem.
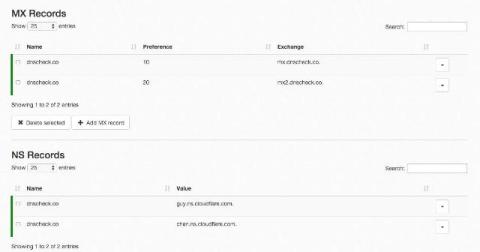
Monitoring the Monitor: When One of Our Uptime Vendors Went Quiet for 27 Hours

DNS Check watches its own infrastructure with several layers of monitoring, including DNS Check itself and third-party uptime monitoring services. One of those vendors polls a private health endpoint on our servers every five minutes, from probes around the world. That endpoint runs a set of internal checks (disk space, mail delivery, background job queues, DNS resolvers, and more) and returns an error if any of them fail. If it errors or stops responding, the vendor alerts us.

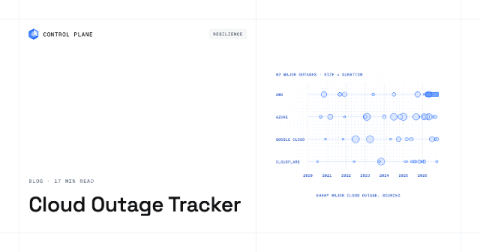
Cloud Outage Tracker: Major AWS, Azure, Google Cloud, and Cloudflare Outages Since 2020

Last updated: October 21, 2026. This tracker lists every major AWS, Microsoft Azure, Google Cloud, and Cloudflare outage since January 2020, with each provider’s own stated duration, root cause, and source. It covers 62 major incidents. The median outage lasted 6h 12m, and the most common cause was a configuration or deployment change (20 of 62, 32%), not hardware failure. We add new incidents as providers publish their post-incident reports. Control Plane publishes this tracker.

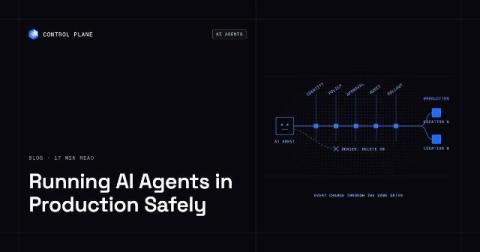
How to Let AI Agents Operate Production Infrastructure Safely

Yes, it can be safe to let an AI agent change production infrastructure, if the agent works through the same controls you would demand of a new engineer: scoped permissions, short-lived credentials, a tamper-proof audit trail, changes that roll out gradually behind health checks, and a fast rollback. The infrastructure also has to be built so that one bad change cannot take everything down.

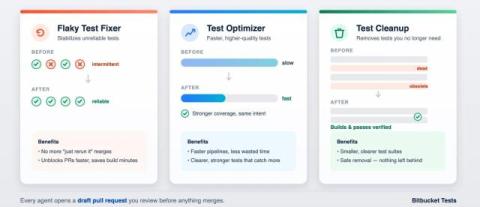
Optimize your test suite with two new agents

Flaky tests stall pull requests. Slow tests drag out builds. Outdated tests add maintenance work that’s easy to put off. To help optimize your test suite, we’re adding two new agents in Bitbucket, Test Optimizer and Test Cleanup and an improved Flaky Test Fixer. With these agents, your team will spend less time babysitting tests and more time shipping.

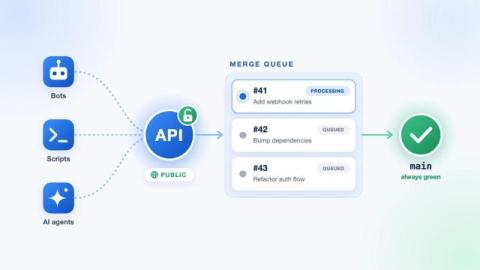
Merge queue APIs now available in Bitbucket Cloud

Merge Queues help keep your busy branches stable by testing how changes work together before they’re merged. Today, we’re introducing public APIs for Merge Queues, available to all Standard and Premium workspaces in Bitbucket Cloud. The new APIs let your tools use the existing merge endpoint to queue pull requests, track their progress and respond to the outcome.

Scout Monitoring Is Now in Claude's Connector Directory

A customer messages support: checkout feels slow today. You open Scout, find the endpoint, open a trace, spot the query, copy it into Claude, and ask what’s wrong with it. Each step is quick, but together they add up to a lot of tab switching to answer one question. Scout Monitoring is now available in Claude’s connector directory. Connect it once and Claude can look at your production data directly.

Introducing AI Observability: Trace Every AI Agent Request from Prompt to Pod

TL;DR Logz.io AI Observability provides end-to-end tracing for AI agents and LLM applications. Built on OpenTelemetry, it lets you trace every request from prompt to backend service, visualize multi-step agent execution, isolate root causes across models and infrastructure, and track token usage per step, all alongside your existing logs, metrics, and traces.

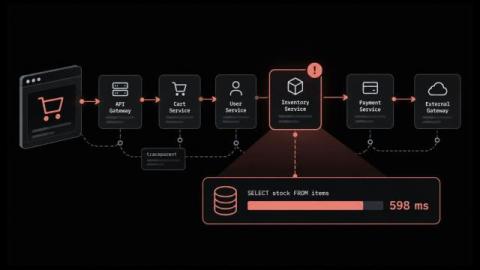
What is Distributed Tracing? How a Request Becomes a Trace

A checkout request leaves the browser and touches seven services before anything comes back. Seven dashboards light up. Every one of them reports a healthy number for its own service, and every one of them is telling the truth about a different slice of the work. Nobody measured the request. That gap is what pushed tracing in beside metrics and logs as a core signal of observability. In this blog, you will: By the end you will open a trace and say where the time went.