Operations | Monitoring | ITSM | DevOps | Cloud

The latest News and Information on DevOps, CI/CD, Automation and related technologies.

What is a Single-Line Diagram and What is It Used For?

A single-line diagram (also known as an SLD or one-line diagram) is a simplified representation of an electrical system. Symbols and lines are used to represent the nodes and connections in the system, and electrical characteristics may be included as well. In a data center, a single-line diagram is used to visualize the power distribution system to improve planning and troubleshooting, ensure redundancy, and reduce potential outages.
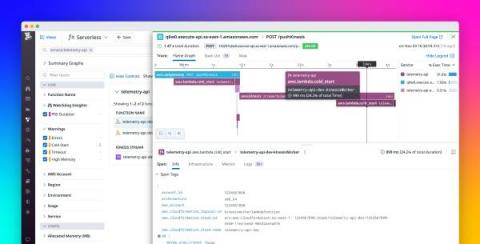

Expanded Datadog Lambda extension capabilities with the AWS Lambda Telemetry API

In 2021, we partnered with AWS to develop the Datadog Lambda extension which provides a simple, cost-effective way for teams to collect traces, logs, custom metrics, and enhanced metrics from Lambda functions and submit them to Datadog.

Grafana alerting

A lot of organizations are using Grafana to visualize information and get notified about events happening within their infrastructure or data. In this article, we will show how to create and configure Grafana Alert rules. To get started, log in to the MetricFire free trial, where you can send metrics and make Grafana dashboards right on our platform.

Effective vulnerability management for your microservices

Vulnerabilities are part and parcel of the software development life cycle. If left untreated, they can expose your application to malicious attacks, which can be detrimental to its functioning and reliability. To avoid severe damage and complications that arise from having the vulnerabilities exposed, it is good practice to set up a vulnerability management system. Vulnerability management is a practice that teams should integrate into the larger development process as it helps keep the software secure.

7 Essential Factors When Choosing Platform Engineering Solution

The trend of Platform Engineering is now gaining momentum, which analysts and industry experts refer to as one of the most disruptive philosophies of the moment. But regardless of experts’ predictions and assumptions, what matters for organizations today is understanding what adopting an approach such as Platform Engineering actually entails, what a successful solution looks like, and how to adopt best practices for its implementation. That's what this article is about.

Grafana vs. Tableau

When it comes to visualization tools, there are various options, all designed for different kinds of data. Some of the most recognized among them include Grafana and Tableau. If you’re not sure which one to use, this article should give you a better idea of what kind of purpose each one has and which one will suit your needs best. One great way to find out what tool works best for you is to try it out! Try out Grafana in seconds on MetricFire's Hosted Grafana free trial.

Sponsored Post

How to Test Autoscaling in Kubernetes

In an ideal world, you want to have precisely the capacity to manage the requests of your users, from peak periods to off-peak hours. If you need three servers to attend to all the requests at peak periods and just one server at off-peak hours, running three servers all the time is going to drive up expenses, and running just one server all the time is going to mean that during peak periods, your systems will be overwhelmed and some clients will be denied service.

Keeping Track of Kubernetes Deprecated Resources

It’s a fact of life: as the Kubernetes API evolves, it’s periodically reorganized or upgraded. This means some Kubernetes resources can be deprecated and later removed. We deserve to keep track of those deprecations and removals easily. For that, we have just released the new deprecated-api-versions policy for Kubewarden, our efficient Kubernetes policy engine that runs policies compiled to Wasm.