Operations | Monitoring | ITSM | DevOps | Cloud

The latest News and Information on Monitoring for Websites, Applications, APIs, Infrastructure, and other technologies.

Uptimia greets Spring with a fresh look

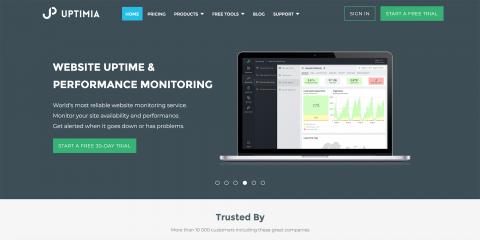
It has been around 2 years since we changed our looks, so it is right about time to try something fresh! In addition to design changes, we also updated our free tools - Website Availability Test and Website Speed Test. Even though Availability Tool functionality is the same, Website Speed Test tool has been redesigned completely - now we test website speed from 11 different checkpoints around the globe, to give you a good overview of how your website performs far away from your datacenters.


Icinga Monthly Snap February: Icinga Camp Berlin & New York, Howtos & #icingalove

Icinga is coming to Berlin for the 3rd time next week, and we are super excited to share the latest developments with you. And of course to meet again with our awesome community and have a couple of G&Ts :) If you can’t make it, our first Icinga Camp New York happens on March 16th the week after!

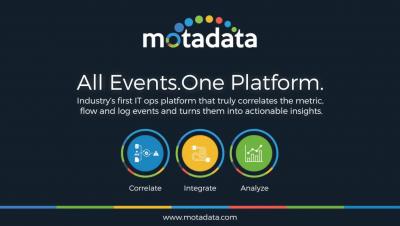
Motadata: Correlate Integrate Analyze your IT Infrastructure Stack

Motadata platform is built for every member of your IT team to monitor, track and deliver great business services. Upgrade your existing monitoring tools with one unified analytics platform for performance monitoring, network behavior analytics, log management and SIEM. To provide uninterrupted services to the users, operational team need correlated data, integrations across the board to collect & automate, analytics capabilities to monitor & visualize critical metrics which allows making more informed decisions. Motadata platform can help you do just that – Correlate, Integrate and Analyze IT infrastructure stack.

Sean Porter | DATA COLLECTION & PROMETHEUS SCRAPING WITH SENSU 2.0

Sean will demonstrate how Sensu 2.0 is designed to collect monitoring and telemetry data from these heterogeneous environments and store them in InfluxDB. Sensu 2.0 is the next release of the open source monitoring framework, rewritten in Go, with new capabilities and reduced operational overhead. Using Sensu alongside InfluxDB, Sean will go over various patterns of data collection, including scraping Prometheus metrics, and show how Sensu enables self-service data collection for service owners.

Nathaniel Cook | KAPACITOR STREAM PROCESSING

Kapacitor is the brains of the TICK Stack. Nathaniel will cover the stream processing capabilities of Kapacitor, how to process data before it gets stored in InfluxDB and after it is stored, best practices around anomaly detection and machine learning. In addition, Nathaniel will discuss how to configure the clustered version of Kapacitor.

David Cromberge | WHY YOU DEFINITELY DON'T WANT TO BUILD YOUR OWN TIME SERIES DATABASE

At Outlyer, an infrastructure monitoring tool, we had to build our own TSDB back in 2015 to support our service. Two years later, we decided to take a different direction after seeing for ourselves how hard it is to build and scale a TSDB. This talk will review our journey, the challenges we hit trying to scale a TSDB for large customers and hopefully talk some people out of trying to build one themselves because it is not easy!