Operations | Monitoring | ITSM | DevOps | Cloud

Learning in public: How to speed up your learning and benefit the OSS community, too

Technical folks in OSS communities often find themselves in permanent learning mode. Technology changes constantly, which means learning new things — whether it’s a new feature in the latest OSS release or an emerging industry best practice — is, for many of us, simply a natural part of our jobs. This is why it’s important to think about how we learn, and improve the skill of learning itself.
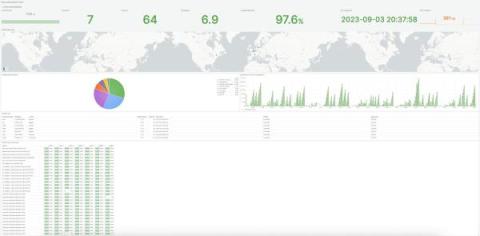
How universities preserve and protect digital assets with Grafana dashboards

Anthony Leroy has been a software engineer at the Libraries of the Université libre de Bruxelles (Belgium) since 2011. He is in charge of the digitization infrastructure and the digital preservation program of the University Libraries. He coordinates the activities of the SAFE distributed preservation network, an international LOCKSS network operated by seven partner universities.

Introducing agentless monitoring for Prometheus in Grafana Cloud

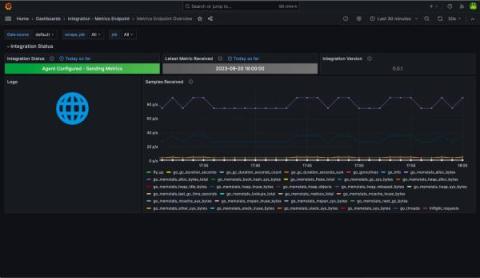
We’re excited to announce the Metrics Endpoint integration, our agentless solution for bringing your Prometheus metrics into Grafana Cloud from any compatible endpoint on the internet. Grafana Cloud solutions provide a seamless observability experience for your infrastructure. Engineers get out-of-the-box dashboards, rules, and alerts they can use to visualize what is important and get notified when things need attention.

Auto-Instrumenting Node.js with OpenTelemetry & Jaeger

Six months ago I attempted to get OpenTelemetry (OTEL) metrics working in JavaScript, and after a couple of days of getting absolutely no-where, I gave up. But here I am, back for more punishment... but this time I found success! In this article I demonstrate how to instrument a Node.js application for traces using OpenTelemetry and to export the resulting spans to Jaeger. For simplicity, I'm going to export directly to Jaeger (not via the OpenTelemetry Collector).

How to create an alert rule in Grafana 10.1

You may have built an alert rule with Grafana Alerting and then grappled with routing, reconfiguring, and managing the different alerts your team set up. To address this challenge, we’ve implemented a series of improvements to set up and maintain alert rules in Grafana. Watch how the new alerting workflow works.

Grafana 10.1: TraceQL query results streaming

Tempo offers amazing performance, but there are still cases where TraceQL queries take a long time to return results. This could be due to a multitude of reasons from the complexity of the query, amount of choices stored, or the timeframe selected. See how to navigate your query results more quickly, with query results streaming, available as an experimental feature in Grafana version 10.1.