Operations | Monitoring | ITSM | DevOps | Cloud

How savepoints quietly throttled our Postgres queue

At incident.io we are huge fans of Postgres; we've written about it a lot over the years, including how to choose the right indexes and how we're proud of being boring (The Pet Shop Boys). We use Postgres as our primary transactional database, which as of today has ~900 tables, and counting! The vast majority of our codebase does something along the following lines: read some data from Postgres, execute some business logic, then write that data back to Postgres. It is not, however, always that simple.

Ship faster, improve reliability, and control CI costs with Datadog CI/CD Optimization

AI-assisted development can increase the rate at which teams produce code, but teams only realize those velocity gains if CI can keep pace. More pull requests (PRs) mean more builds, tests, and pipeline executions. Slow jobs leave developers and coding agents waiting for feedback, flaky failures consume time in reruns and investigations, and unnecessary test execution increases runner demand as delivery volume grows.

Shipped: See what your AI spend is actually paying for

Most AI spend comes in with no tags and no owner attached. Your provider console shows total spend, maybe broken out by API key or model. It won’t tell you that the sales team spent $1,700 on Claude this week, let alone what the work was. And the problem is growing. McKinsey found that 56% of organizations now use AI in three or more business functions. More teams means more spend, and most companies respond with a spending cap. Set it too low and you slow down the work you wanted AI to help with.

Automated Medical Answering Services: Cost and Setup Guide

After-hours calls can create missed messages and send urgent issues to the wrong clinician. For private medical practices, that risk grows when call answering and on-call escalation rely on the same loosely defined workflow. Answering service receives an inbound call, captures information, and categorizes the request. On-call routing identifies the responsible clinician, delivers the message, and escalates it when the clinician does not respond.

How to Filter and Reduce AI Agent Telemetry with OpenTelemetry & Bindplane

Why is the telemetry AI agents generate so intimidating? If you turn on Claude Code’s internal telemetry it’ll throw a wall of text at you. And, it’s very expensive to store. But, the bigger issue is that you can’t make sense of it. Luckily it’s all OpenTelemetry native. That means you can configure it to send, transform, and store what you really need. Which raises the only question that matters. What do you actually need?

Canada Data Center Development: Measuring Responsible AI Growth

Western Canada is becoming a live test of whether sovereign AI capacity can be built responsibly at scale, and the answer will depend less on what operators promise than on what they can measure and show. Meta’s planned C$13-billion Alberta data center, BCE’s expansion of its Saskatchewan project to a 1.2-GW hub, and the federal Responsible Data Centre Development Principles all point to the same requirement: operational transparency that regulators, utilities, and communities can verify.

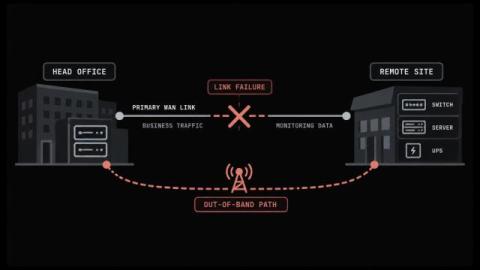
Remote Infrastructure Management: How to Run Sites With No IT Staff

Most IT teams now look after more sites than they have people to visit. Remote infrastructure management covers that gap, and it works differently from the IT infrastructure management you run inside a building where somebody can walk over and look at whatever broke. The technology rarely causes the trouble. Trouble starts when a site goes quiet and there's nobody standing there to look at it.

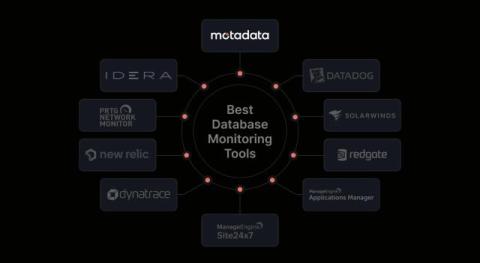
10 Best Database Monitoring Tools for 2026

If your company relies on multiple databases and applications, keeping track of database performance can become difficult. You may face challenges such as: As your database environment grows, identifying the cause of performance issues becomes harder without the right monitoring in place. I get why database monitoring tools have become an important part of managing database performance. They help you monitor database activity, spot performance issues, and find what is causing a slowdown.