While many statistics are floating around the web, let's consider slow page speeds from a more personal viewpoint. How many times have you waited for a web page to load, then felt frustration, anger, or even desperation as it crawled? In addition, the experience may have even given you a negative impression of the website, possibly to the extent you never want to load it again. With over 1.8 billion websites in existence, slow websites are very likely to lose precious visitor traffic.
Data Science and business are co-related in much more ways in this modern world. As data is the key to drive businesses, Data Science solutions are the bridge that helps achieve the organizational goal to improve business value. Many companies extending from large scale to small scale use the wide possibilities of data science to make their business successful.
Monitoring is crucial if you want to see what happens in your system and JVM-based applications are not different. Well, some metrics, like memory and garbage collection, require special attention because they play a major role in your application performance. In this blog post, we will look into the key Java Virtual Machine (JVM) metrics that you should monitor if you care about performance and stability. Those are the memory, the garbage collection, and the JVM threads.
SquaredUp, Technical Evangelist This should be a quick one. As some of the existing SquaredUp customers might recognize, this tile is basically an enhanced version of the more generic WebAPI tile – with the enhancement being easy authentication. In comparison to the <
Today every problem has a solution that evolved into powerful software troubleshooting and performance analytics capable of analysing and deconstructing the entire application for issues and bugs. Since most web offerings monitored these days are multi-tiered applications, Datadog and Atatus are leading APM software in this category.
In case you missed it, for about 15 minutes on June 8, 2021, Fastly's CDN had an outage, taking some of the internet's largest websites down (including the BBC, UK government, Reddit, and the New York Times - Amazon.com also had its CSS fail to load).
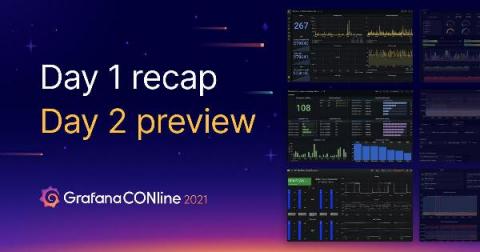
GrafanaCONline 2021 is live! Join us over the next two weeks for more than 30 virtual sessions, ranging from demos of the new Grafana 8.0 release and technical deep dives around Grafana, Prometheus, Loki, and Tempo to insider looks at how companies are leveraging Grafana in observability, IoT, science, and business intelligence. GrafanaCONline 2021 runs through June 17.
Customers need scale and flexibility from their cloud and this extends into supporting services such as monitoring and logging. Google Cloud’s Monitoring and Logging observability services are built on the same platforms used by all of Google that handle over 16 million metrics queries per second, 2.5 exabytes of logs per month, and over 14 quadrillion metric points on disk, as of 2020.