Operations | Monitoring | ITSM | DevOps | Cloud

Latest Posts

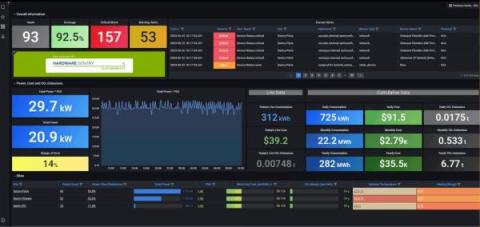
Reducing data center carbon emissions with Hardware Sentry, Grafana, and OpenTelemetry

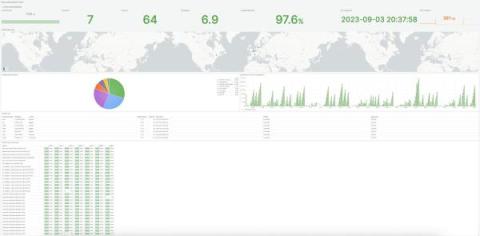
With just 30 employees, Sentry Software might be considered a small company, but they’re prioritizing sustainability in a big way. As the makers of Hardware Sentry, an IT monitoring software, a large part of their business relies on maintaining optimal temperature conditions at their data centers — an operation that contributes to the company’s overall carbon footprint.

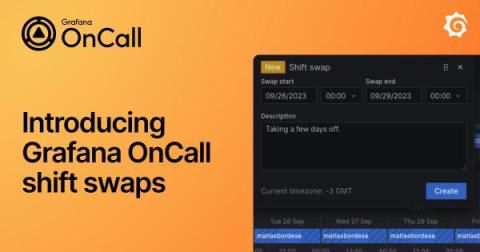
Introducing Grafana OnCall shift swaps: A simpler way to exchange on-call shifts with teammates

A family member’s birthday, that concert you’ve waited all year to see, an impromptu weekend getaway with friends — there are a lot of reasons software engineers might want to switch on-call shifts. And rather than have to frantically send Slack messages to your teammates, wouldn’t it be nice to automate the process and quickly find the coverage you need?

Introducing the Prometheus Java client 1.0.0

PromCon, the annual Prometheus community conference, is around the corner, and this year I’ll have exciting news to share from the Prometheus Java community: The highly anticipated 1.0.0 version of the Prometheus Java client library is here! At Grafana Labs, we’re big proponents of Prometheus. And as a maintainer of the Prometheus Java client library, I highly appreciate the support, as it helps us to drive innovation in the Prometheus community.

OpenTelemetry metrics: A guide to Delta vs. Cumulative temporality trade-offs

In OpenTelemetry metrics, there are two temporalities, Delta and Cumulative and the OpenTelemetry community has a good guide on the different trade-offs of each. However, the guide tackles the problem from the SDK end. It does not cover the complexity that arises from the collection pipeline. This post takes that into account and covers the architecture and considerations that are involved end-to-end for picking the temporality.

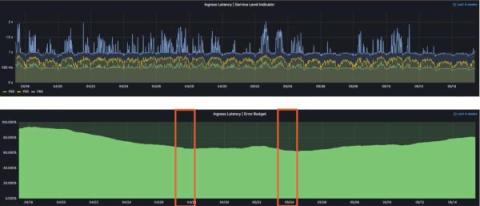
How to monitor SLOs with Grafana, Grafana Loki, Prometheus, and Pyrra: Inside the Daimler Truck observability stack

In order for fleet managers at Daimler Truck to manage the day-to-day operations of their vast connected vehicles service, they use tb.lx, a digital product studio that delivers near real-time data along with valuable insights for their networks of trucks and buses around the world. Each connected vehicle utilizes the cTP, an installed piece of technology that generates a small mountain of telemetry data, including speed, GPS position, acceleration values, braking force and more.

Better anomaly detection in system observability and performance testing with Grafana k6

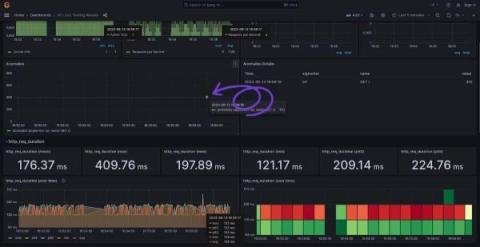
Grzegorz Piechnik is a performance engineer who runs his own blog, creates YouTube videos, and develops open source tools. He is also a k6 Champion. You can follow him here. From the beginning of my career in IT, I was taught to automate every repeatable aspect of my work. When it came to performance testing and system observability, there was always one thing that bothered me: the lack of automation. When I entered projects, I encountered either technological barriers or budgetary constraints.

Learning in public: How to speed up your learning and benefit the OSS community, too

Technical folks in OSS communities often find themselves in permanent learning mode. Technology changes constantly, which means learning new things — whether it’s a new feature in the latest OSS release or an emerging industry best practice — is, for many of us, simply a natural part of our jobs. This is why it’s important to think about how we learn, and improve the skill of learning itself.

How universities preserve and protect digital assets with Grafana dashboards

Anthony Leroy has been a software engineer at the Libraries of the Université libre de Bruxelles (Belgium) since 2011. He is in charge of the digitization infrastructure and the digital preservation program of the University Libraries. He coordinates the activities of the SAFE distributed preservation network, an international LOCKSS network operated by seven partner universities.

Introducing agentless monitoring for Prometheus in Grafana Cloud

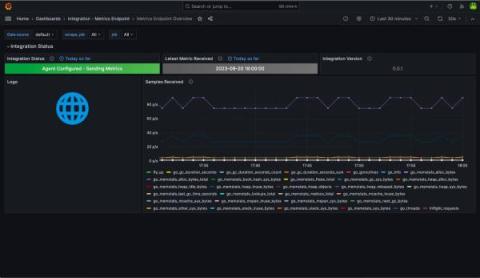
We’re excited to announce the Metrics Endpoint integration, our agentless solution for bringing your Prometheus metrics into Grafana Cloud from any compatible endpoint on the internet. Grafana Cloud solutions provide a seamless observability experience for your infrastructure. Engineers get out-of-the-box dashboards, rules, and alerts they can use to visualize what is important and get notified when things need attention.

Troubleshoot failed performance tests faster with Distributed Tracing in Grafana Cloud k6

Performance testing plays a critical role in application reliability. It enables developers and engineering teams to catch issues before they reach production or impact the end-user experience. Understanding performance test results and acting on them, however, has always been a challenge. This is due to the visibility gap between the black-box data from performance testing and the internal white-box data of the system being tested.