Operations | Monitoring | ITSM | DevOps | Cloud

Latest News

Accelerate Observability with Catchpoint and Wavefront

Web applications have evolved from static pages with minimal user interaction to a dynamic intuitive interface that delivers advanced functionality. the complex architecture of these applications makes it necessary to monitor and maintain application health, performance, and end-user experience. Catchpoint’s monitoring platform provides all the tools you need to track application performance.

Building an Observable Enterprise App

Once an app is launched to market, it’s up to the engineering team to ensure that it continues to meet its SLAs. See how we use VMware Tanzu Observability (Wavefront) and Sentry to proactively monitor and fix issues before they become production problems. Every engineering leader has experienced the anxiety and stress of taking an app to production. It’s a mix of excitement and trepidation – your creation will be used in real life, but what if something goes wrong?

Tracing Tools Compared: Jaeger vs. OpenTracing

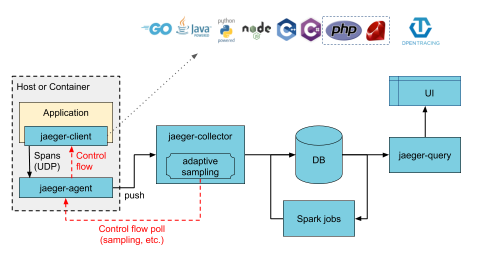
With the advent of microservices, technologies like Docker, Kubernetes and services like Cloud Computing, have showcased the broader need for observability. Collecting valuable information about the communication endpoints and how they propagate through the discrete components of the application stack is the key to understanding when, why and what happens in case of failure.

The First OpenObservability Conference is a Wrap

Last week, the first OpenObservability conference took place. This event had amazing content contributions from open source project leaders, users, and influencers. We’ve seen massive growth and adoption in the open source observability space from the inspiring work being done across tracing, logging, and especially metrics. The new data stores and capabilities are growing at breakneck speed. There are more choices— yet more complexity—than ever before.

Can Observability Improve IT Ops? BigPanda's Field CTOs have the answer.

A Harrowing Landscape The increasing complexity of modern services is forcing IT Ops teams to employ a growing landscape of disparate tools to monitor the health of their IT Stack. In fact, the number of tools has grown so much in the last few years, that one wonders how IT Ops teams are even able to effectively configure, maintain, ingest, and process all the events that these tools create.

Identifying and monitoring key metrics for your hosts and systems

This post is the first in a three-part series on how to effectively monitor the hosts and systems in your ecosystem, and we're starting with the one you use most: your personal computer. Metrics are a key part of observability, providing insight into the usage of your systems, allowing you to optimize for efficiency and plan for growth. Let's take a look at the different metrics you should be monitoring.

New in Grafana 7.0: Trace viewer and integrations with Jaeger and Zipkin

Moving to a scalable, distributed microservice architecture poses a great deal of challenges for any organization. It gets harder to understand the system and pinpoint where errors originate. Logs get much messier, and stitching together a coherent picture of a particular request can be time-consuming or downright impossible. Distributed tracing can help with all of that.

We listened. Simpler Pricing. You're welcome.

I’ve tackled this question before: how much should my observability stack cost? While the things in that post are true now as ever, I did end on one somewhat vague conclusion. When it came to figuring out exactly what you need in your stack by drawing a straight line from the business case to the money you spend, my conclusion was that “it depends.” That’s how we approached pricing at Honeycomb: it depends on your needs, so we should give you many different options.

Applying AIOps to Logs Is Key for Observability

Logging is an essential method to understanding what’s happening in your environment. Logs help developers and system administrators understand where and when things have gone wrong. Ideally, logs on their own would suffice as indicators of what’s happening. However, there’s far too many log messages being produced in today’s world and most don’t contain the information we actually need.

Mitigate Logging Costs While Maintaining Full Observability with Logz.io

Considering the scale of log data that modern cloud environments generate, it’s oftentimes prohibitively expensive to index all of it. For monitoring and logging, cost management is just as important as in other parts of the business. Whether sudden spikes of log data overwhelm databases or good business generates more activity in your environment, teams should anticipate and mitigate the steep costs that result from high log volumes.