Operations | Monitoring | ITSM | DevOps | Cloud

Latest News

Take Your Monitoring Insights to another Level Using New Analytic Views

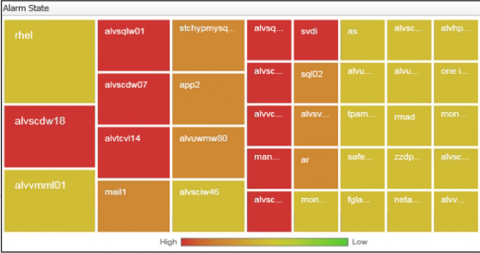
Foglight 5.9.3 (core Foglight release) includes among its features new components for building dashboards called “analytic views”. The new view types are: Scatter Plot Chart, Bubble Chart and Tree Map Chart. Specifically, I’ll cover here how to use these in the Foglight “Drag and Drop” interface to easily create new views that can show your monitoring data in new, powerful ways.

5 Best Practices for Using Sumo Logic Notebooks for Data Science

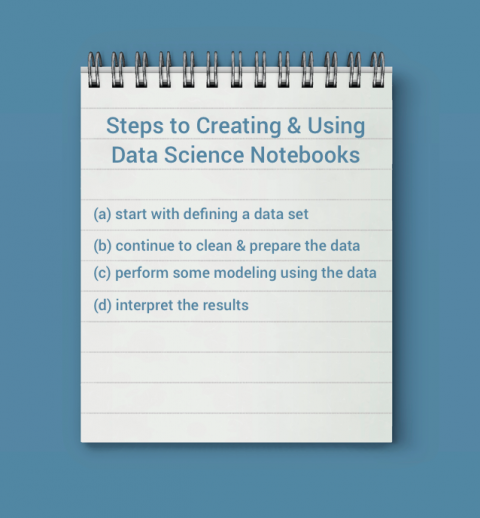
This year, at Sumo Logic’s third annual user conference, Illuminate 2018, we presented Sumo Logic Notebooks as a way to do data science in Sumo Logic. Sumo Logic Notebooks are an experimental feature that integrate Sumo Logic, notebooks and common machine learning frameworks. They are a bold attempt to go beyond what the current Sumo Logic product has to offer and enable a data science workflow leveraging our core platform.

PHP Performance: Five Types of Tools You Need To Know

To all the developers out there, it is highly advisable that every application you build should have tools that will monitor performance and ensure that it runs correctly. There are a variety of tools available that can monitor your application’s performance. Choosing the right tool that caters to your organization’s needs should be a priority.

Groovy, groovier, grooviest: Getting metrics collected by Foglight

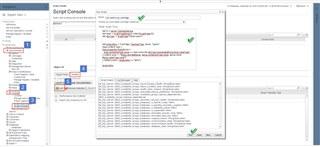
What if you could get a list of all metrics and observations collected by Foglight, and have the ability to filter/sort by cartridge and topology type? That would be groovy. My colleague Mark.Bai developed the script below. To run it, navigate to Administration -> Tooling -> Script Console. Select the Scripts tab and click the Add button.

Sysdig Monitor 3.0 - Enterprise-grade Prometheus, Kubernetes insights and more.

Today we announced the launch of enterprise-grade Prometheus monitoring with Sysdig Monitor 3.0. We’ve added new Prometheus capabilities like PromQL, a Grafana plugin and new enhancements for our already rich Kubernetes monitoring. If you love Prometheus like we do, and especially if your cloud environment is growing quickly, read on to learn more about what we’re doing with Prometheus, Kubernetes and more.

NiCE Announces Management Pack For VMware

With the start of the Microsoft Ignite conference at Orlando today, NiCE adds a new product to its portfolio of Management Packs for System Center Operations Manager (SCOM). The NiCE VMware MP provides real time monitoring of your VMware environments with full integration into your System Center deployment, allowing a return on investment within months. It is feature loaded and exceeds comparable monitoring solutions for VMware operations significantly.