Operations | Monitoring | ITSM | DevOps | Cloud

Latest News

StackStorm Enterprise HA in Kubernetes - eta

More groups are progressing from just talking about Event-Driven Automation to actually doing it in practice. StackStorm helps make this easy. When organizations start offloading business-critical tasks and automating for real it becomes essential to ensure that the Automation engine itself is not a single point of failure when it is responsible for recovering a fleet of servers, managing datacenters, and automating remediations.

Kubernetes and containers adoption growing fast

Cloud-native development and microservices enable development teams to work more efficiently and innovate faster. Operators appreciate the container environment because it increases infrastructure utilization, enabling them to accomplish more with less while managing critical applications at unprecedented scale. Kubernetes and containers adoption growing fast in the last few years.

Icinga 2.9.2 released

Icinga 2 v2.9 introduced performance related changes inside the configuration compilation and activation order. This was to ensure a) no unwanted notifications b) use available CPU resources to speed up the overall validation process. These changes had a bad effect on configuration depending on a specific activation order, and slowed it down with many config objects of a specific type. The Icinga Director depends on get_host() being called in service objects to support specific service set overrides.

USE, RED and real world PgBouncer monitoring

Brendan Gregg’s USE (Utilization, Saturation, Errors) method for monitoring is quite known. There are even some monitoring dashboard templates shared on the Internet. There’s also Tom Wilkie’s RED (Rate, Errors, Durations) method, which is suggested to be better suited to monitor microservices than USE. We, at okmeter.io, recently updated our PgBouncer monitoring plugin and while doing that we’ve tried to comb everything and we used USE and RED as frameworks to do so.

Get your own Uptrends Checkpoint

Your private network is teeming with web services (APIs), intranet, business applications like CRMs and ERPs, acceptance and preproduction environments, databases, and other servers. Your business relies on your network infrastructure to function every day. Each part of that infrastructure needs to be available, performing, and functioning well to keep your business humming along.

Reduce Noise in Your DevOps Toolchain

In an ideal world, your DevOps toolchain would be highly automated for incident management and allow your teams to resolve issues at DevOps speed. An alert triggered by monitoring tools like Datadog or AWS Cloudwatch would notify on-call engineers, kick your collaboration tools into gear (ChatOps, StatusPage, etc), and automatically document the issue in ITSM and ticketing tools.

Simplifying security auditing, part 5: Detecting network attacks

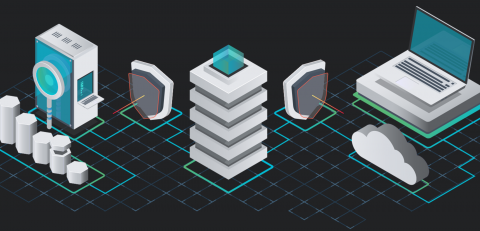
Anyone trying to access resources in your network needs to interact with your network devices: firewalls, routers, switches, and IDS/IPSs. Each of these devices generate syslogs that contain important security information and must be audited to gain complete visibility into the activities occurring in your network. Most SIEM solutions, including our own Log360, can collect and analyze syslogs in real time and instantly alert security teams if any security event of interest occurs.

The challenges of choosing an APM tool

How do you choose an APM tool? You search online and you see there is a lot of choice. But you can only choose one. And it's a big decision. You need to find a tool that can monitor your crown jewel applications. You know that the cost of an APM tool is high. And you know that it's going to be a challenging and lengthy process to implement it.