Python is a highly skilled language with a large developer community, which is essential in data science, machine learning, embedded applications, and back-end web and cloud applications. And logging is critical to understanding software behavior in Python. Once logs are in place, log monitoring can be utilized to make sense of what is happening in the software. Python includes several logging libraries that create and direct logs to their assigned targets.
Graphite is free and open-source software. It is used as a time-series database monitoring tool, where you can collect, store and display time-series data in real-time. As you can monitor certain metrics of this data using Graphite, it has a very useful and simple dashboard used to visualize these metrics. This article will show you how to display a metric on your Graphite dashboard. MetricFire specializes in monitoring systems.
Your IT infrastructure needs the best router monitoring software and tools. Are you using an option that helps employees and end-users succeed? Router monitoring software and tools have become essential for administrators to observe their IT infrastructure's traffic, prevent bottlenecks, and improve availability by predicting serious challenges before they occur. The right network monitoring tools give you insight into the overall health of your on-site infrastructure.
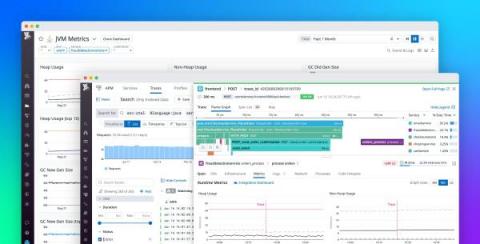
OpenTelemetry (OTel) is an open source, vendor-neutral observability framework that supplies APIs, SDKs, and tools for the instrumentation of applications and services. As part of our ongoing commitment to OTel, we are excited to announce support for the ingestion and visualization of runtime metrics from OTel-instrumented applications in Java, .NET, and Go.
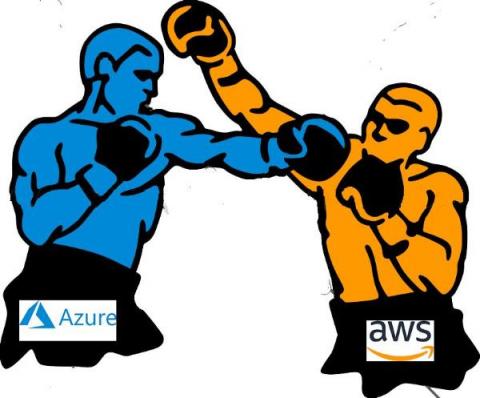
Welcome to the fascinating world of cloud computing! As you traverse this realm, you’re bound to encounter two behemoths, Microsoft Azure and Amazon Web Services (AWS). Each champion in their own right, these two platforms dominate the landscape, offering a myriad of solutions that are designed to propel businesses to greater heights. But, as with most things in life, you’re bound to question which is the better choice for your specific needs.
Grafana is a rich platform for data visualization, giving you full control over how your data should be visualized. However, this flexibility and freedom comes with some challenges from a security perspective — challenges that need to be solved to protect the data in Grafana. For years, cross-site scripting (XSS) has been among the most common web application security vulnerabilities.
Catchpoint recently celebrated a significant milestone, our first patent. The patent protects the work of its inventors, Staff Engineers Alessandro Improta and Luca Sani, VP of Engineering Sergey Katsev, and Chief Product and Technology Officer Dritan Suljoti.