Crawling internal vs. external URLs is now a setting
We've added a setting that allows you to choose if we should crawl all internal URLs or the external URLs too.


We've added a setting that allows you to choose if we should crawl all internal URLs or the external URLs too.
Today we are announcing the support for Windows containers with Kubernetes 1.14 in Preview mode. As many users may know, Rancher 2.1.0 supported Windows containers in experimental mode. Now that SIG Windows and Microsoft have announced the general availability of containers in Windows Server 2019 with Kubernetes 1.14, we have upgraded Rancher to both support the latest version of Windows containers (and Kubernetes) and after the preview is over, make it generally available.
Amazon ECS allows you to run Docker containers your application without having to actually manage physical hardware (or virtual hardware, in the case of the Fargate launch type). However, since it’s a managed service, you have less visibility with traditional monitoring tools. As such, it becomes even more important to take advantage of the available monitoring tools in AWS. In this post, we’ll explain how to use CloudWatch to monitor ECS and what is important to watch.
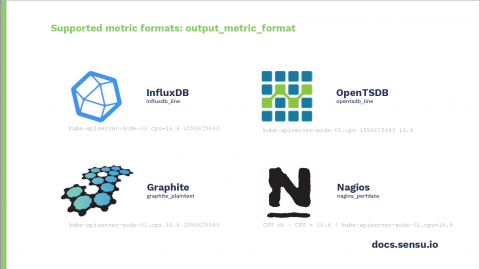
“To start, your monitoring stack should not cost you stacks,” Sensu Software Engineer Nikki Attea told the crowd at GrafanaCon L.A. “Avocado toast is really expensive. But the good news is your monitoring solution doesn’t have to be.” To prove it, Attea presented an easy developer-centric use case that leverages Sensu, a monitoring event pipeline which collects, processes, and roots different event types including discovery, availability, telemetry, and alerts.
Monitoring has always relied on both network administration and network traffic analysis. Both fields provide ways to obtain data that allows us to obtain information about the general state of the platform. It is easy to understand that when faced with, for example, an application performance problem, we want to be able to observe and evaluate the traffic generated, and this is just what network traffic analysis does.
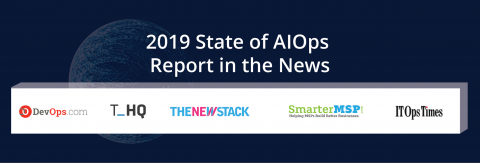
This blog covers the industry press for OpsRamp’s State of AIOps Report. We’ll be reviewing the findings from this report in our upcoming webinar, The State of AIOps For Incident Management and Beyond on Wednesday, May 15th.
It is difficult to overstate the importance and impact that Artificial Intelligence (AI) has had on the employee experience. This is crystal clear when you see how employees are interacting with their IT departments. Employees expect technology to just work. When there are technical problems the expectation is that fixing the issue will be fast and seamless. An increasingly important part of meeting this employee demand is the virtual agent, or chatbot.
Source code management (SCM) is a core component of DevOps. In addition to storing and sharing source code, SCM tools maintain an ongoing history of changes. Reviewing this history provides numerous insights into your development process, including: How often code changes are submitted, The impact of changes on application performance, Which changes result in errors, bugs, or broken builds.
As the first part of the three-part series on monitoring Apache Solr, this article explores which Solr metrics are important to monitor and why. The second part of the series covers Solr open source monitoring tools and identify the tools and techniques you need to help you monitor and administer Solr and SolrCloud in production.